Full Report
The numbers behind eToro Group Ltd.: as-reported financial statements and company metrics for FY2022–FY2025, traced to the source filings, opened with the share-price history those statements have to justify. Every linked figure opens the exact page of the filing it was printed on, with the statement row highlighted. Amounts in US$ thousands unless noted.
Reading notes: All figures in US$ thousands, as printed in eToro's IFRS financial statements (per-share and share-count rows excepted). eToro recognizes cryptoasset trading gross: 'Revenue from cryptoassets' (US$12.98bn in FY2025) is largely offset by 'Cost of revenue from cryptoassets' (US$12.93bn), so headline revenue vastly exceeds economic net contribution — read the revenue mix and net income, not the gross top line. FY2025/FY2024/FY2023 statements are from the FY2025 Form 20-F (audited, 3 income/cash-flow years; 2 balance-sheet years). FY2022 income cash flow are the audited third column of the May 2025 IPO prospectus (Form 424B4). The FY2023 balance sheet is the prospectus comparative column. FY2022 balance sheet is not printed as an audited statement anywhere in the corpus (the prospectus balance sheet shows only 2024/2023). FY2022 balance-sheet cells are from the standardized data feed and are unlinked; eToro-specific lines (Counterparties, Cryptoassets, Payable to users, Accrued expenses) are not carried by the feed and are shown null for FY2022.
Share Price — Available History Since March 2026
The stock closed at $35.67 on Jul 31, 2026 — up 22% over the window shown, trading between $28.90 and $41.98. At that close the stock trades at 16× FY2025 diluted EPS as reported below.
Source: market price feed, daily closes, Mar 2026–Jul 2026 — the feed marks this available history as partial. Price return only, excludes dividends.
Market capitalization $3.4bn.
Market cap = 95.1M shares outstanding × the Jul 31, 2026 close of $35.67. Market-derived, shown without filing links.
FY2025 at a Glance
Revenue (US$ thousands)
Net income (US$ thousands)
Diluted EPS
Source: FY2025 consolidated statements [1] [2]. Click any linked figure to open the filing page with the row highlighted.
Revenue and Income by Type
| Revenue and Income by Type | FY2022 | FY2023 | FY2024 | FY2025 |
|---|---|---|---|---|
| Net trading income from equities, commodities and currencies | 393,480 | 305,850 | 328,706 | 399,362 |
| Revenue from cryptoassets | 5,595,977 | 3,431,274 | 12,147,329 | 12,975,078 |
| Net trading income (loss) from cryptoassets derivatives | 218,526 | (63,105) | (130,729) | 124,032 |
| Net interest income from users | 77,928 | 157,239 | 197,178 | 213,415 |
| Currency conversion and other income | 46,237 | 44,256 | 81,415 | 95,978 |
| Other interest income | 1,641 | 10,104 | 16,654 | 30,067 |
| Total revenue and income | 6,333,789 | 3,885,618 | 12,640,553 | 13,837,932 |
| Total revenue and income growth, derived | — | -38.7% | +225.3% | +9.5% |
Source: Consolidated Statements of Comprehensive Income (Loss) — revenue disaggregation (Note 20); FY2022 from IPO prospectus [1] [2]. Click any linked figure to open the filing page with the row highlighted.
Income Statement
Source: Consolidated Statements of Comprehensive Income (Loss); FY2022 from IPO prospectus [1] [2]. Click any linked figure to open the filing page with the row highlighted.
Columns marked E are consensus analyst estimates from S&P Capital IQ (CapIQ), shown alongside reported results for direct comparison; they are not company guidance.
Estimate source: S&P Capital IQ (CapIQ) consensus, as of 2026-08-01. Estimate figures are S&P Capital IQ consensus (vendor data — no filing page links). EPS and net income use the normalized (adjusted) consensus where the street reports it. Consensus revenue sits well below the as-reported line for the last actual year — analysts often model a narrower revenue basis (e.g. net of interest or pass-through costs), so compare trends, not levels. Line-item analyst models (segments, drivers, KPIs) are in the Visible Alpha tab.
Balance Sheet
Source: Consolidated Statements of Financial Position; FY2023 comparative from IPO prospectus [3] [4]. Click any linked figure to open the filing page with the row highlighted.
Cash Flow
Source: Consolidated Statements of Cash Flows; FY2022 from IPO prospectus [5] [6]. Click any linked figure to open the filing page with the row highlighted.
Key Business Metrics
| Key Business Metrics | FY2022 | FY2023 | FY2024 | FY2025 |
|---|---|---|---|---|
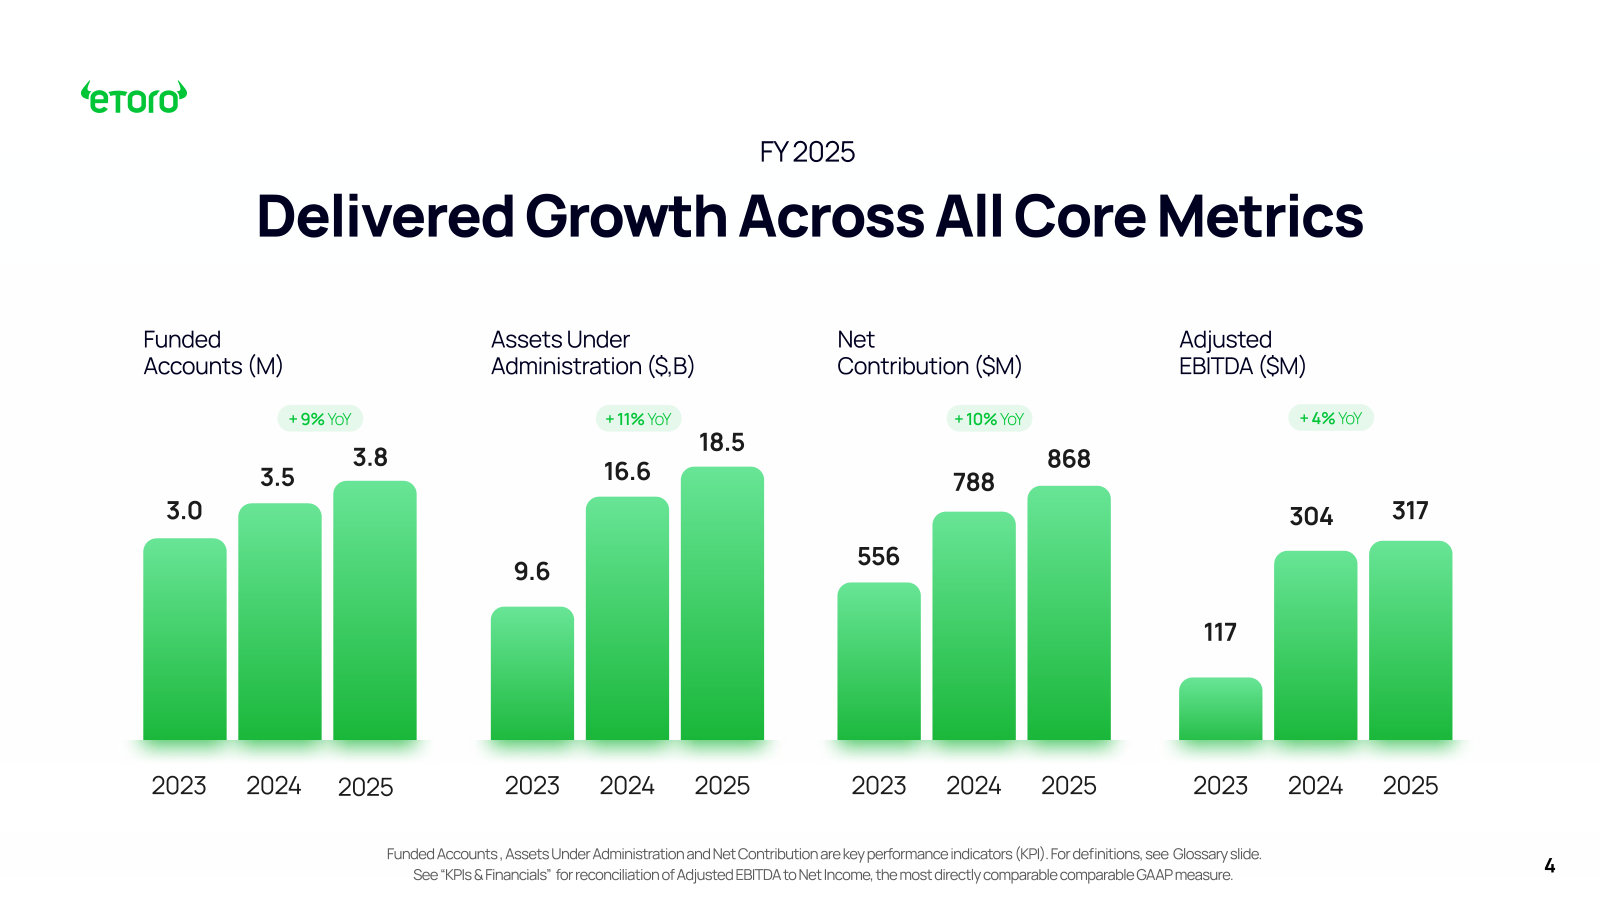
| Funded Accounts (year-end) | — | 3,040,000 | 3,480,000 | 3,810,000 |
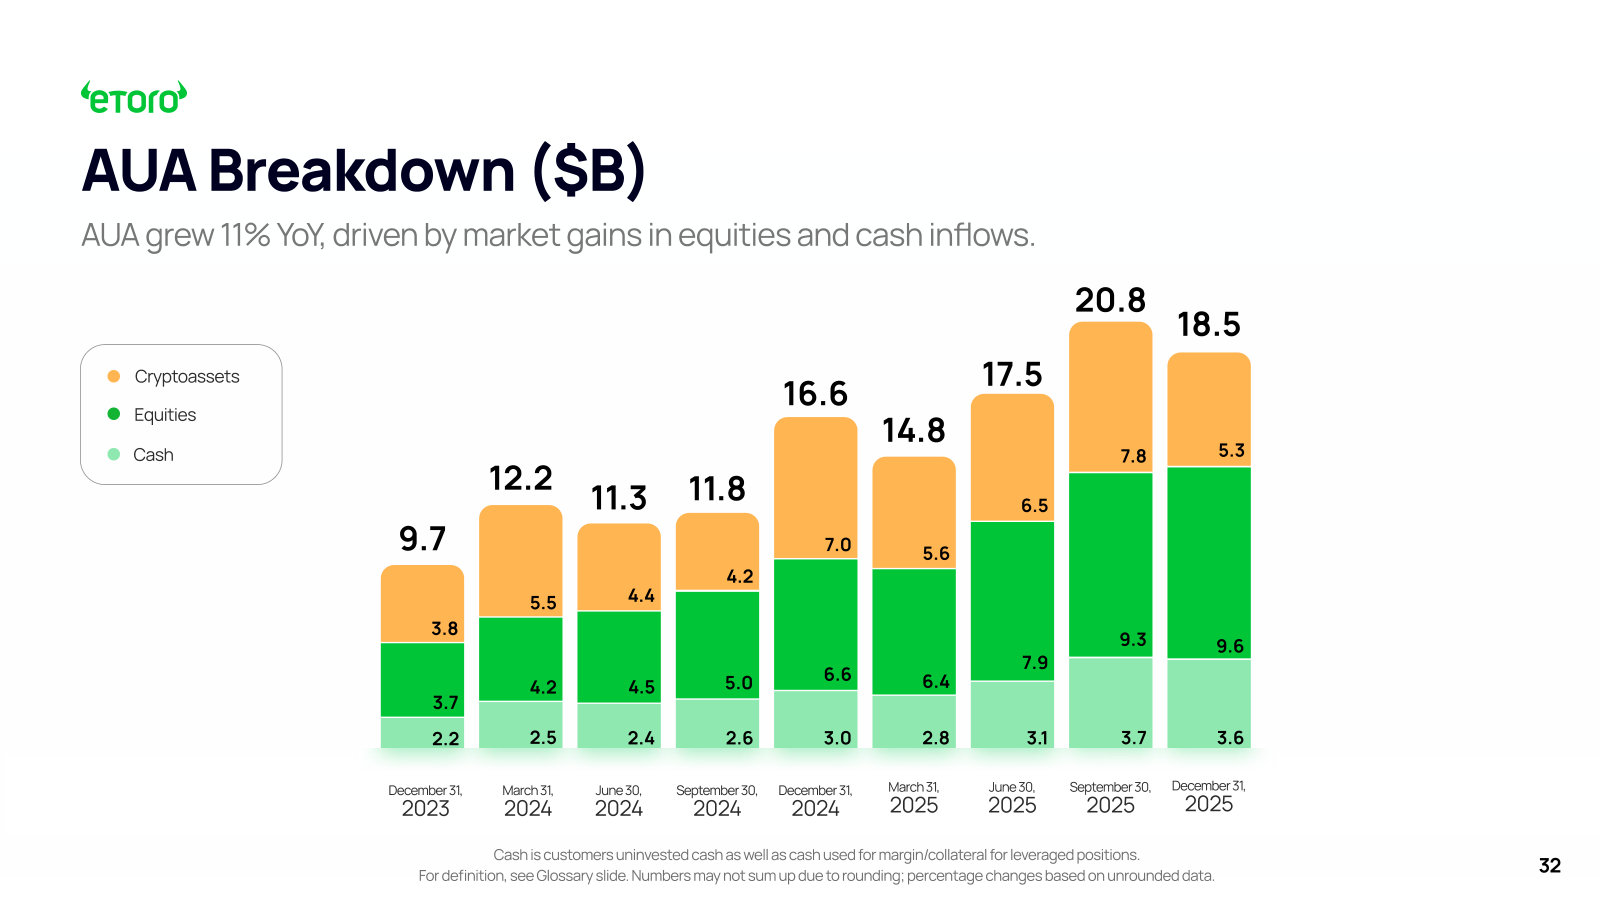
| Assets under Administration | — | 9,600,000 | 16,600,000 | 18,500,000 |
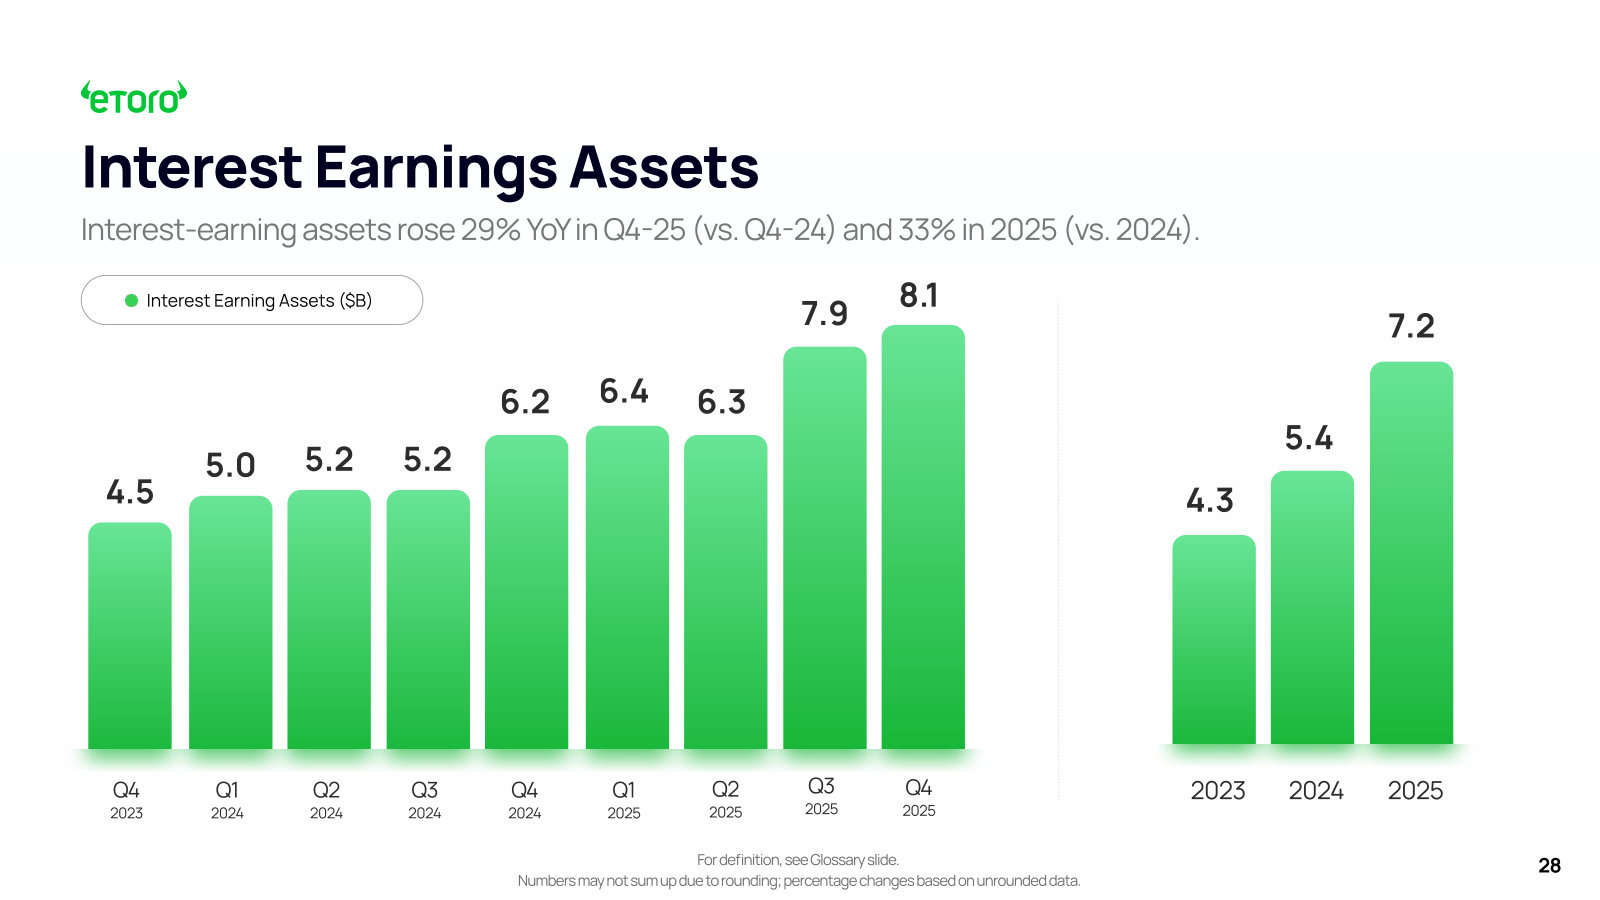
| Total interest-earning assets | — | 4,300,000 | 5,400,000 | 7,200,000 |
| Total money transfers (deposits, withdrawals and cross-currency funding) | — | 5,500,000 | 8,700,000 | 11,600,000 |
Source: company filings [7] [8]. Click any linked figure to open the filing page with the row highlighted.
Trading Platform Activity
| Trading Platform Activity | FY2022 | FY2023 | FY2024 | FY2025 |
|---|---|---|---|---|
| Total trades executed | — | 446,000,000 | 571,000,000 | 594,000,000 |
| Trades — equities, commodities and currencies | — | 415,000,000 | 507,000,000 | 537,000,000 |
| Trades — cryptoassets | — | 31,000,000 | 64,000,000 | 57,000,000 |
| Pro Investors on the platform (year-end) | — | — | — | 4,800 |
Source: company filings [9] [10]. Click any linked figure to open the filing page with the row highlighted.
Profitability Efficiency (non-IFRS)
| Profitability Efficiency (non-IFRS) | FY2022 | FY2023 | FY2024 | FY2025 |
|---|---|---|---|---|
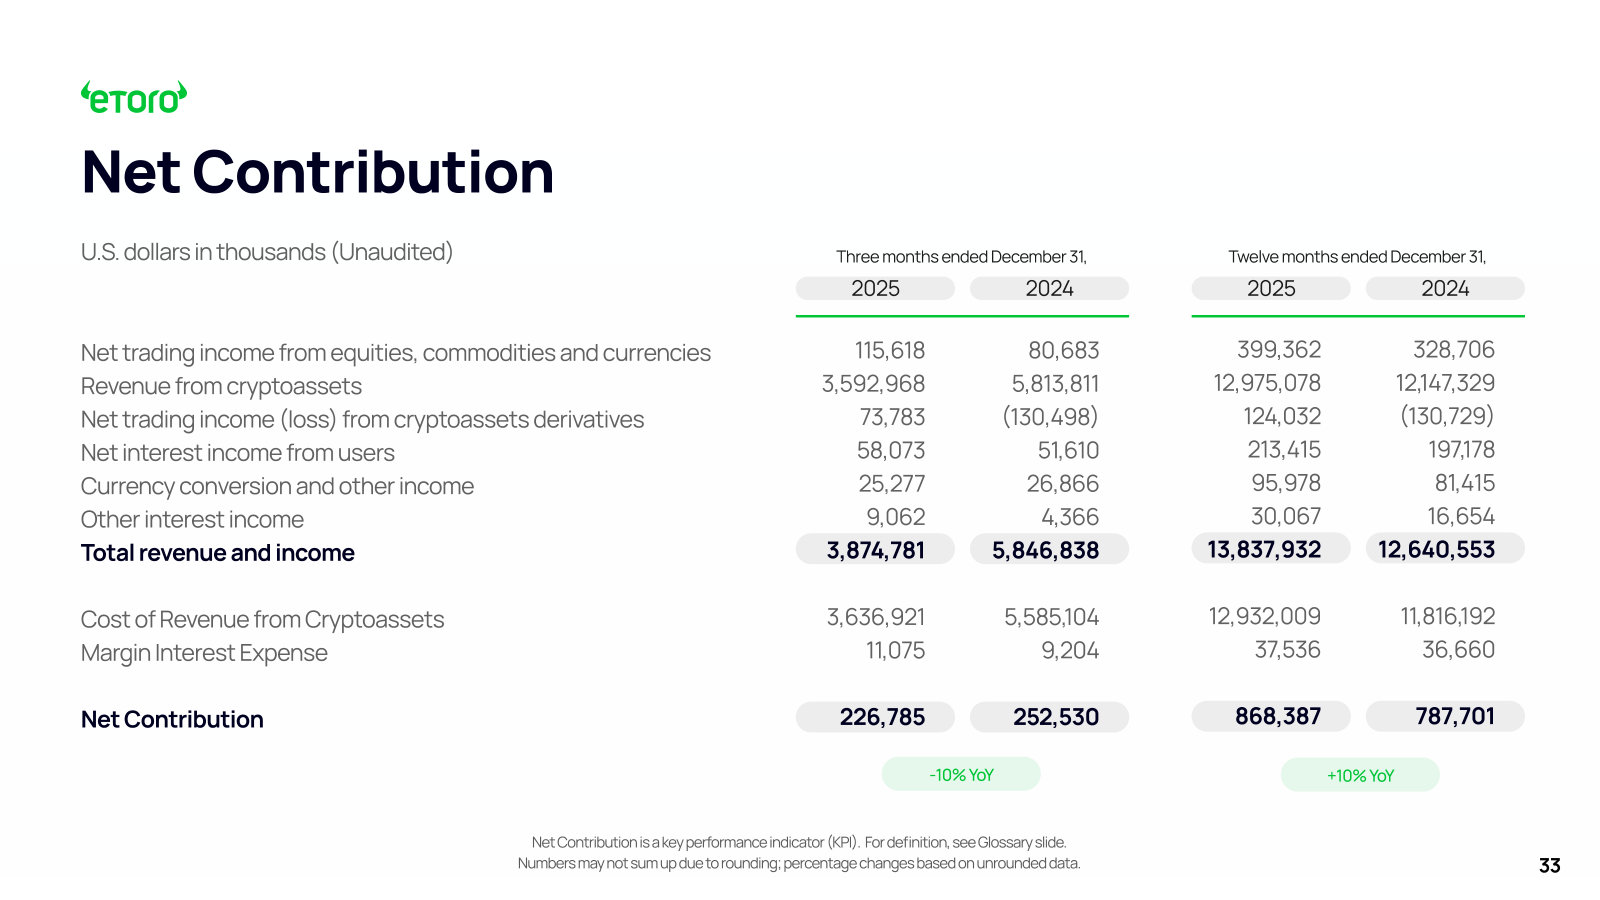
| Net Contribution | — | — | 787,000 | 868,000 |
| Adjusted EBITDA | — | 117,000 | 304,000 | 317,000 |
| Overall marketing costs | — | 116,000 | 147,000 | 176,000 |
| R D costs as % of Net Contribution | — | — | — | 17.4% |
Source: company filings [11] [12] [13] [14]. Click any linked figure to open the filing page with the row highlighted.
Long-Term Record
| Fiscal year | Total revenue and income | Net income | Diluted net income per share | Net cash provided by operating activities |
|---|---|---|---|---|
| FY2022 | 6,333,789 | (214,982) | (2.62) | 346,978 |
| FY2023 | 3,885,618 | 15,259 | 0.18 | 111,834 |
| FY2024 | 12,640,553 | 192,381 | 2.26 | 268,579 |
| FY2025 | 13,837,932 | 215,696 | 2.27 | 318,245 |
Source: consolidated statements across filings; older years from the standardized feed [5] [1] [6] [2]. Click any linked figure to open the filing page with the row highlighted.
Operating KPIs
| KPI | FY2022 | FY2023 | FY2024 | FY2025 |
|---|---|---|---|---|
| Funded Accounts | — | 3,040,000 | 3,480,000 | 3,810,000 |
| Assets under Administration | — | 9,600,000 | 16,600,000 | 18,500,000 |
Source: company-reported operating metrics [7] [15]. Click any linked figure to open the filing page with the row highlighted.
Analyst Consensus
Mean target
Median target
High target
Low target
Street ratings: 8 strong buy, 2 buy, 5 hold. Consensus: Buy.
Estimate source: S&P Capital IQ (CapIQ) consensus, as of 2026-08-01. Estimate figures are S&P Capital IQ consensus (vendor data — no filing page links). EPS and net income use the normalized (adjusted) consensus where the street reports it. Consensus revenue sits well below the as-reported line for the last actual year — analysts often model a narrower revenue basis (e.g. net of interest or pass-through costs), so compare trends, not levels. Line-item analyst models (segments, drivers, KPIs) are in the Visible Alpha tab.
Traceability
276 of 287 figures on this page (96%) link to the filing page where they are printed — click a linked figure to open the source PDF at that page with the row highlighted. Unlinked figures come from standardized data feeds or pre-filing years.
All figures in US$ thousands, as printed in eToro's IFRS financial statements (per-share and share-count rows excepted).
eToro recognizes cryptoasset trading gross: 'Revenue from cryptoassets' (US$12.98bn in FY2025) is largely offset by 'Cost of revenue from cryptoassets' (US$12.93bn), so headline revenue vastly exceeds economic net contribution — read the revenue mix and net income, not the gross top line.
FY2025/FY2024/FY2023 statements are from the FY2025 Form 20-F (audited, 3 income/cash-flow years; 2 balance-sheet years). FY2022 income cash flow are the audited third column of the May 2025 IPO prospectus (Form 424B4). The FY2023 balance sheet is the prospectus comparative column.
FY2022 balance sheet is not printed as an audited statement anywhere in the corpus (the prospectus balance sheet shows only 2024/2023). FY2022 balance-sheet cells are from the standardized data feed and are unlinked; eToro-specific lines (Counterparties, Cryptoassets, Payable to users, Accrued expenses) are not carried by the feed and are shown null for FY2022.
Quarterly figures are from eToro's quarterly earnings releases (condensed statements). Income and cash flow use the printed single-quarter (three months ended) columns; the balance sheet is point-in-time. Own-release single-quarter columns reconcile exactly to the FY2025 audited full year (revenue 13,837,932; net income 215,696; operating cash flow 318,245).
4 figure(s) differed between the data feed and the filing; the filing value is shown (see the run's metrics/metrics_tab.json for the audit trail).
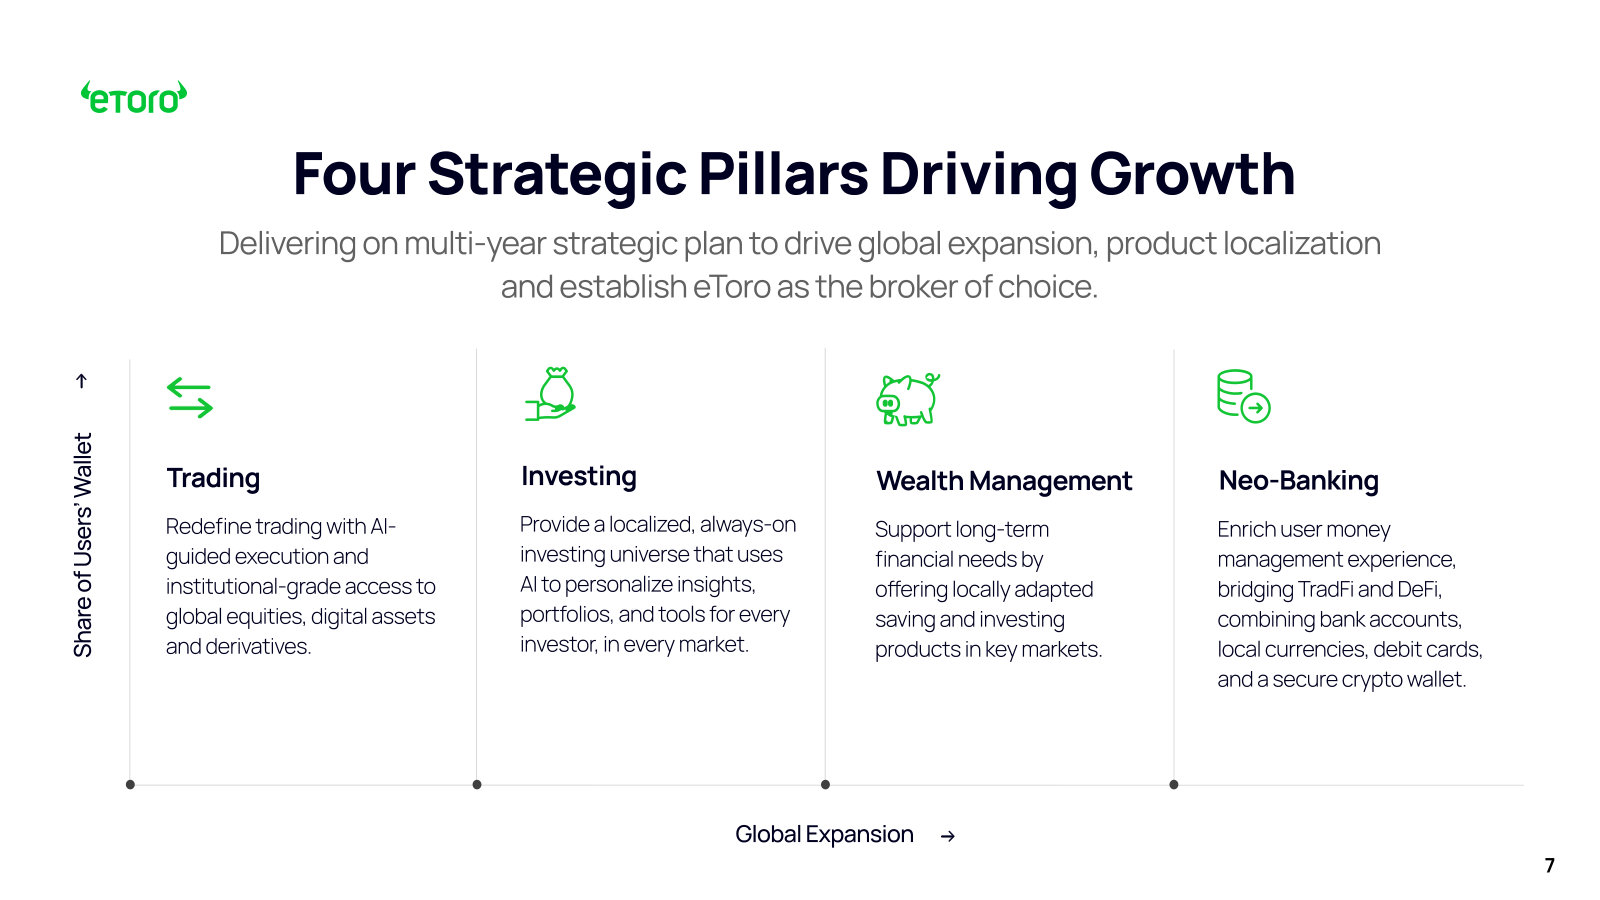
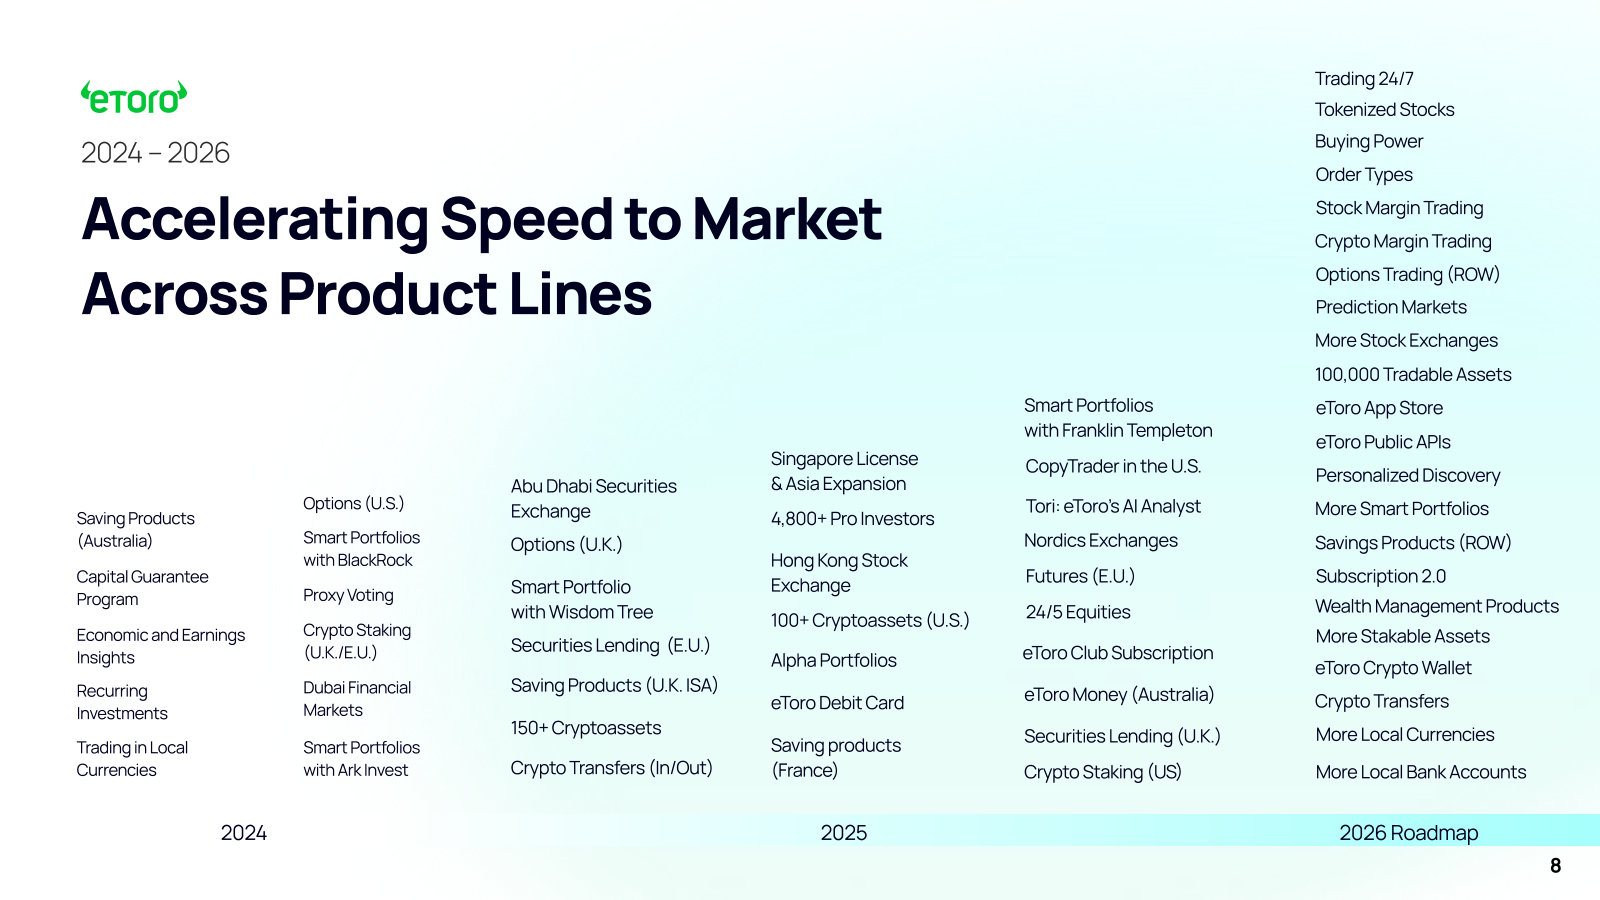
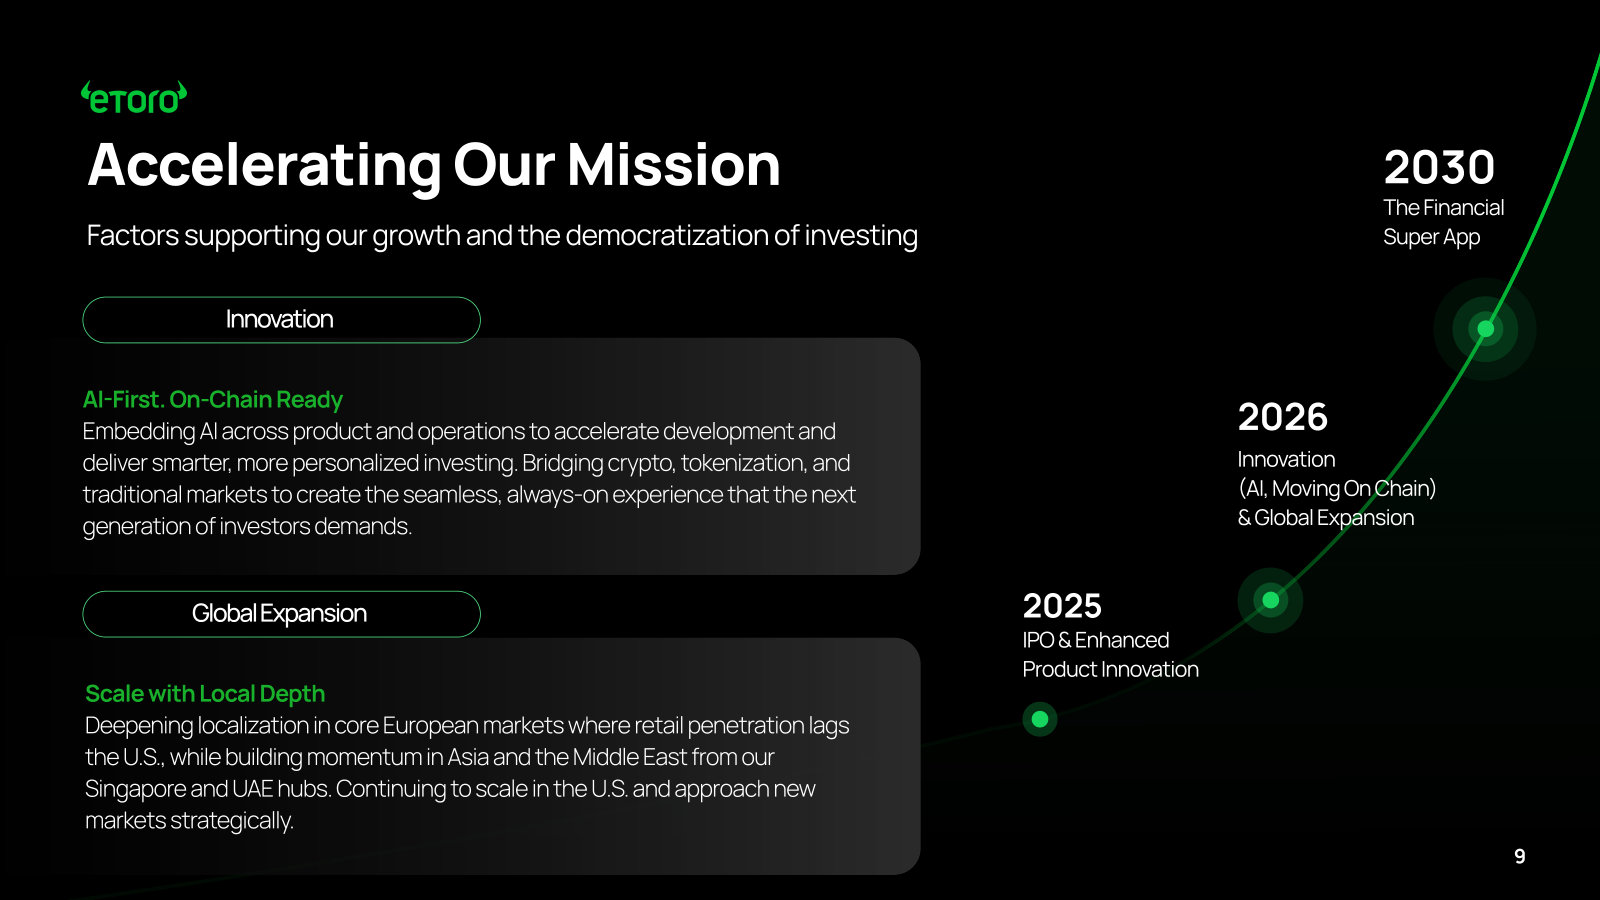
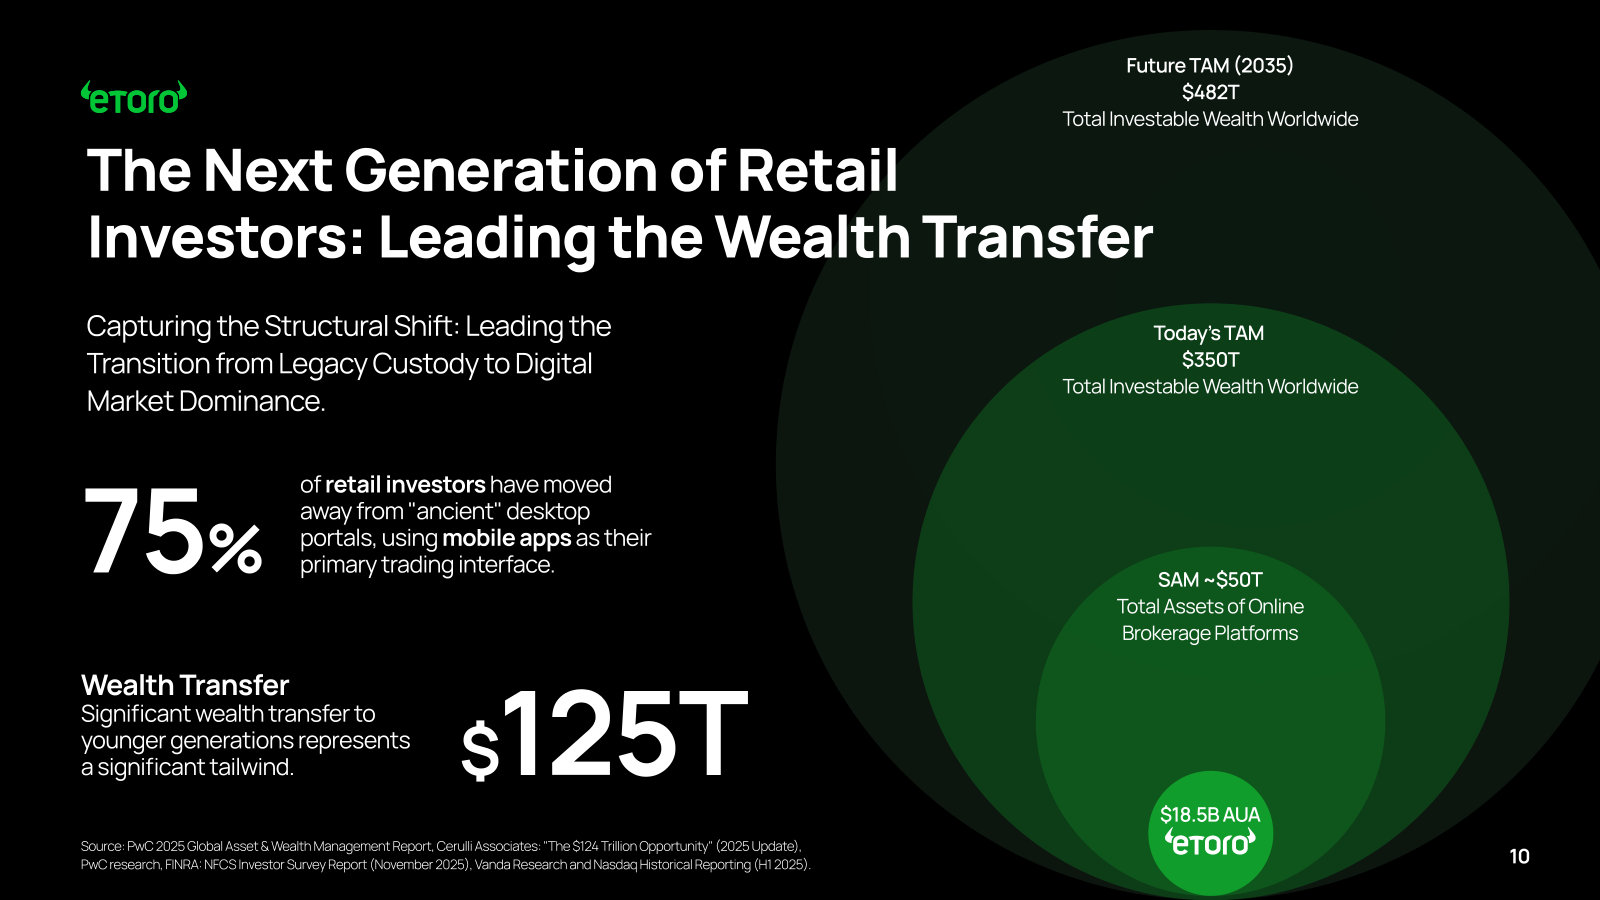
eToro Group Ltd.'s management explains the business in its own materials. The slides below do the most of that work, pulled from the documents preserved in Sources. Each source link opens the complete presentation at that slide in a new tab.
Fourth Quarter & Full Year 2025 Shareholder Update — Q4 & FY 2025
The fullest current statement of the business — vision, the four pillars, every product line, market sizing, unit economics and the revenue model in one deck. The best zero-to-understanding starting point. · Open the full document →
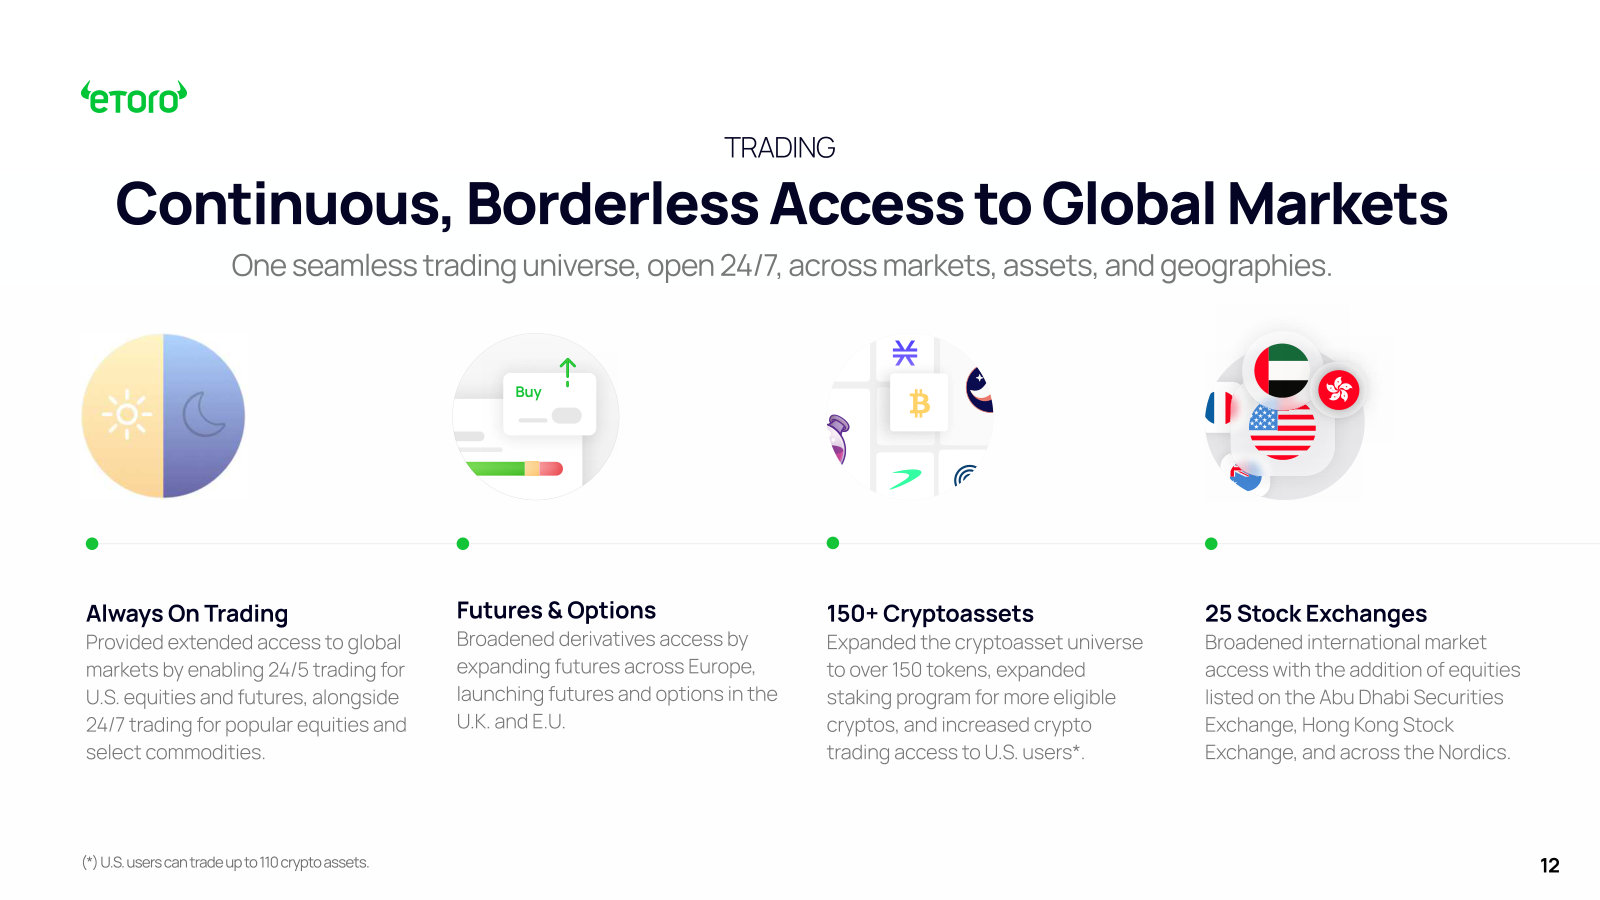
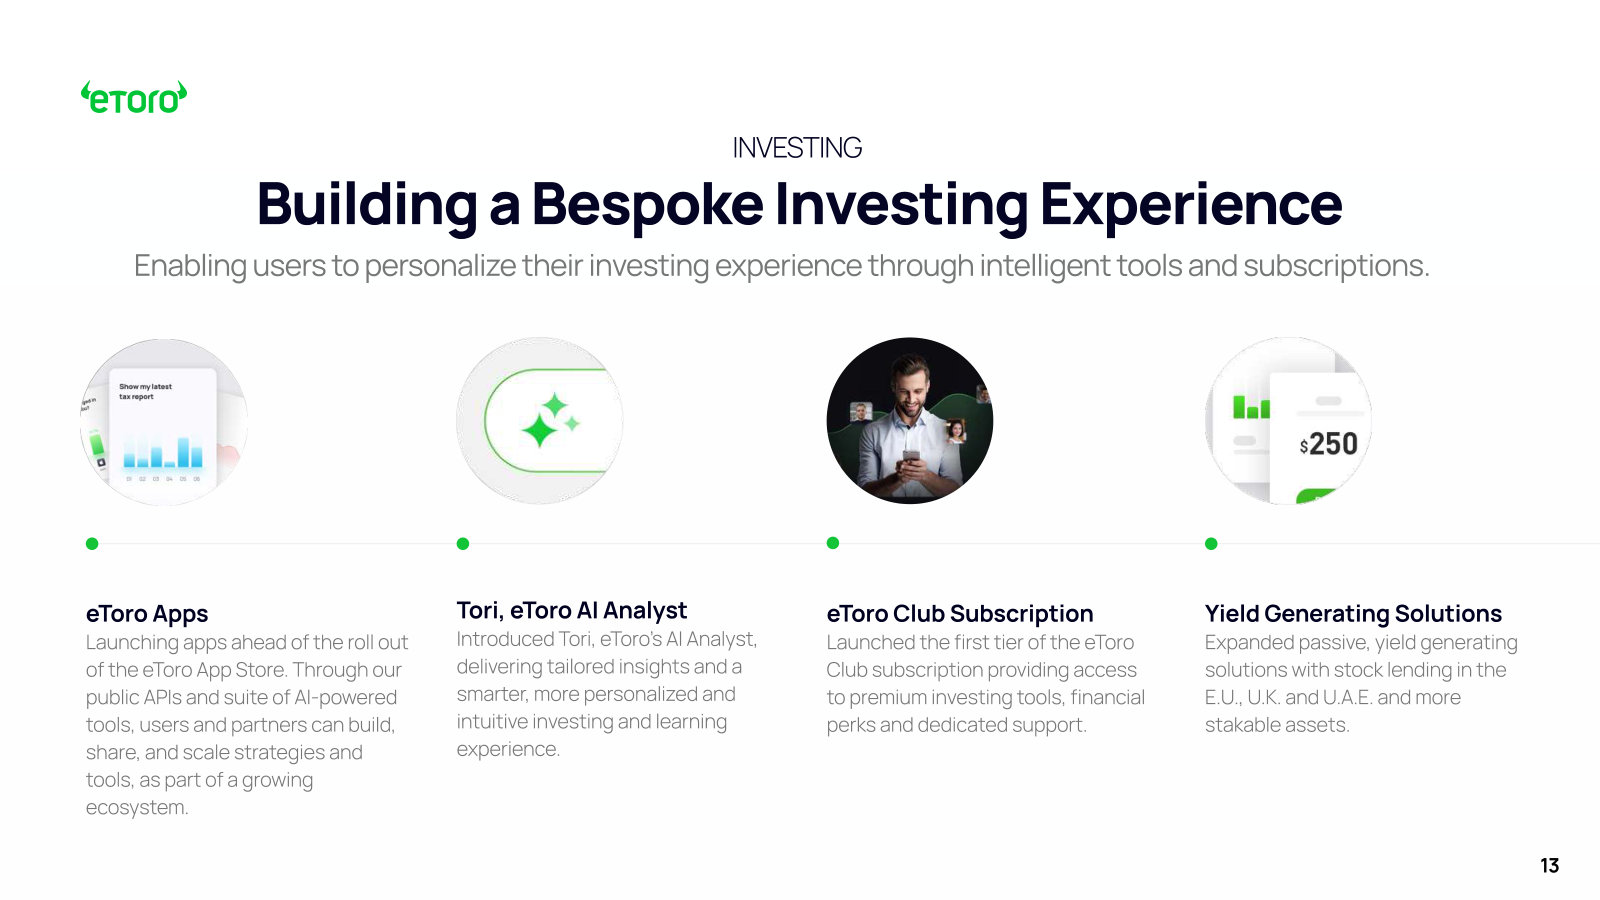
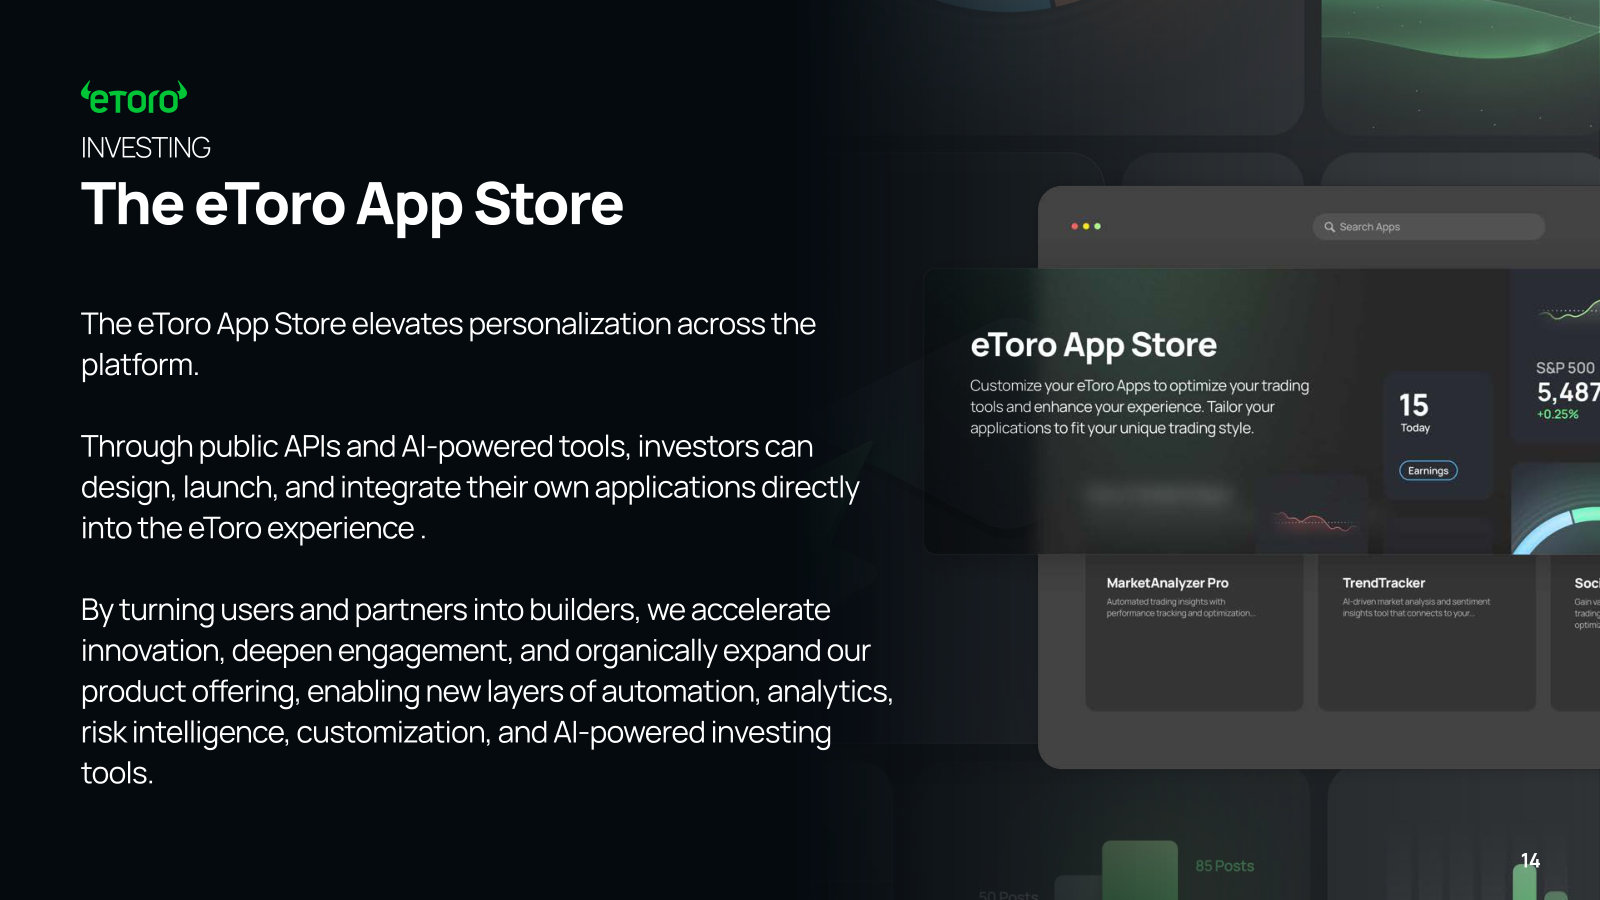
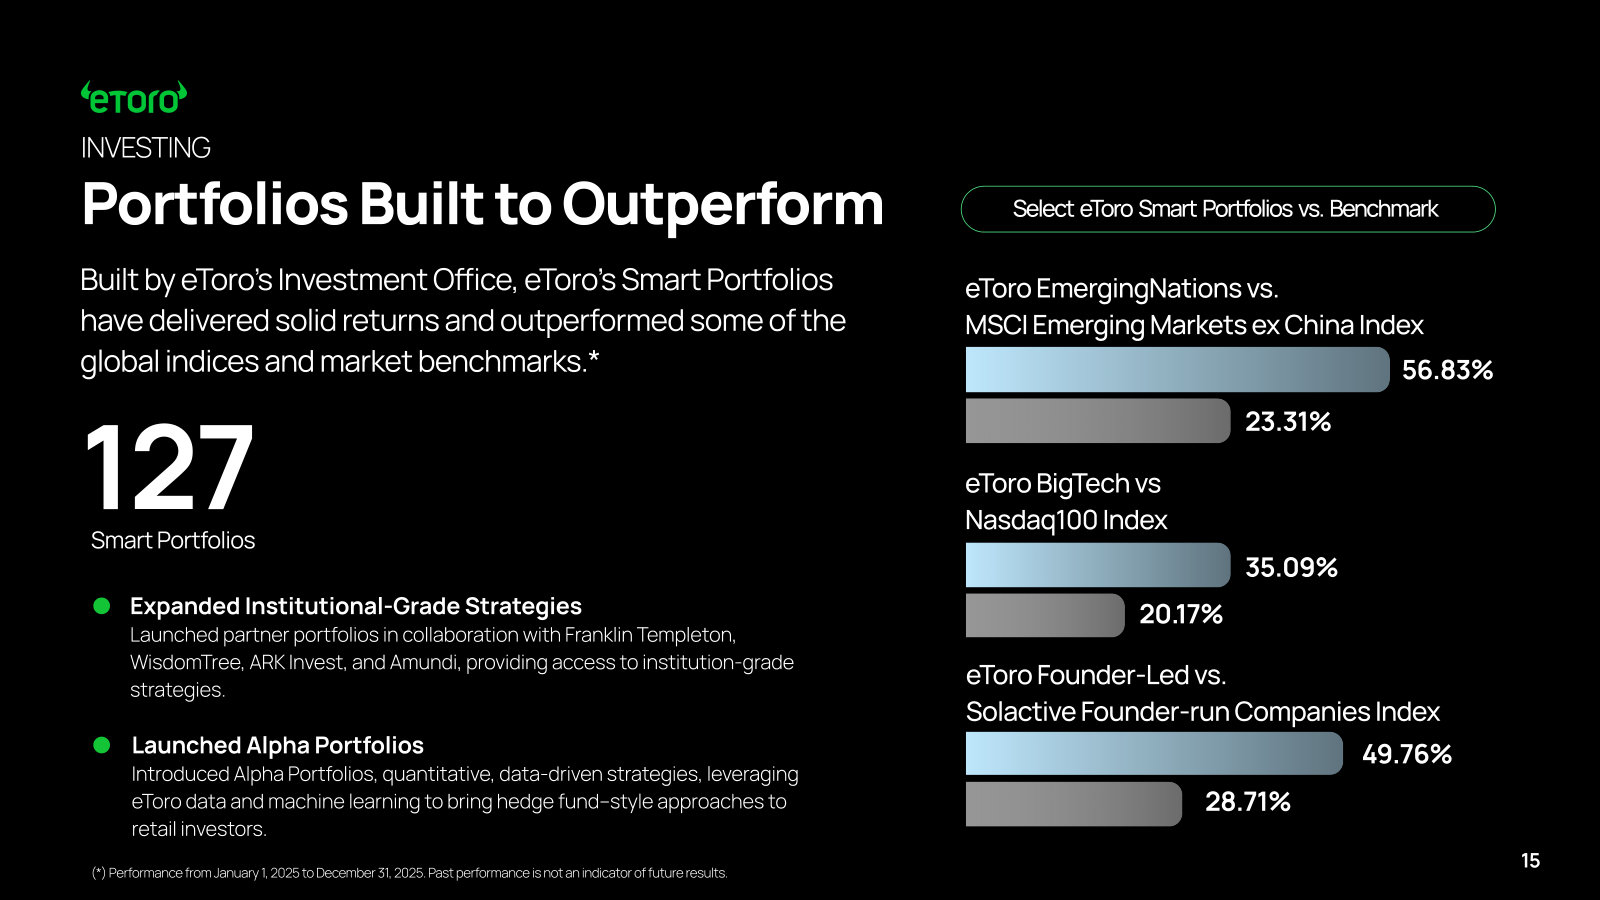
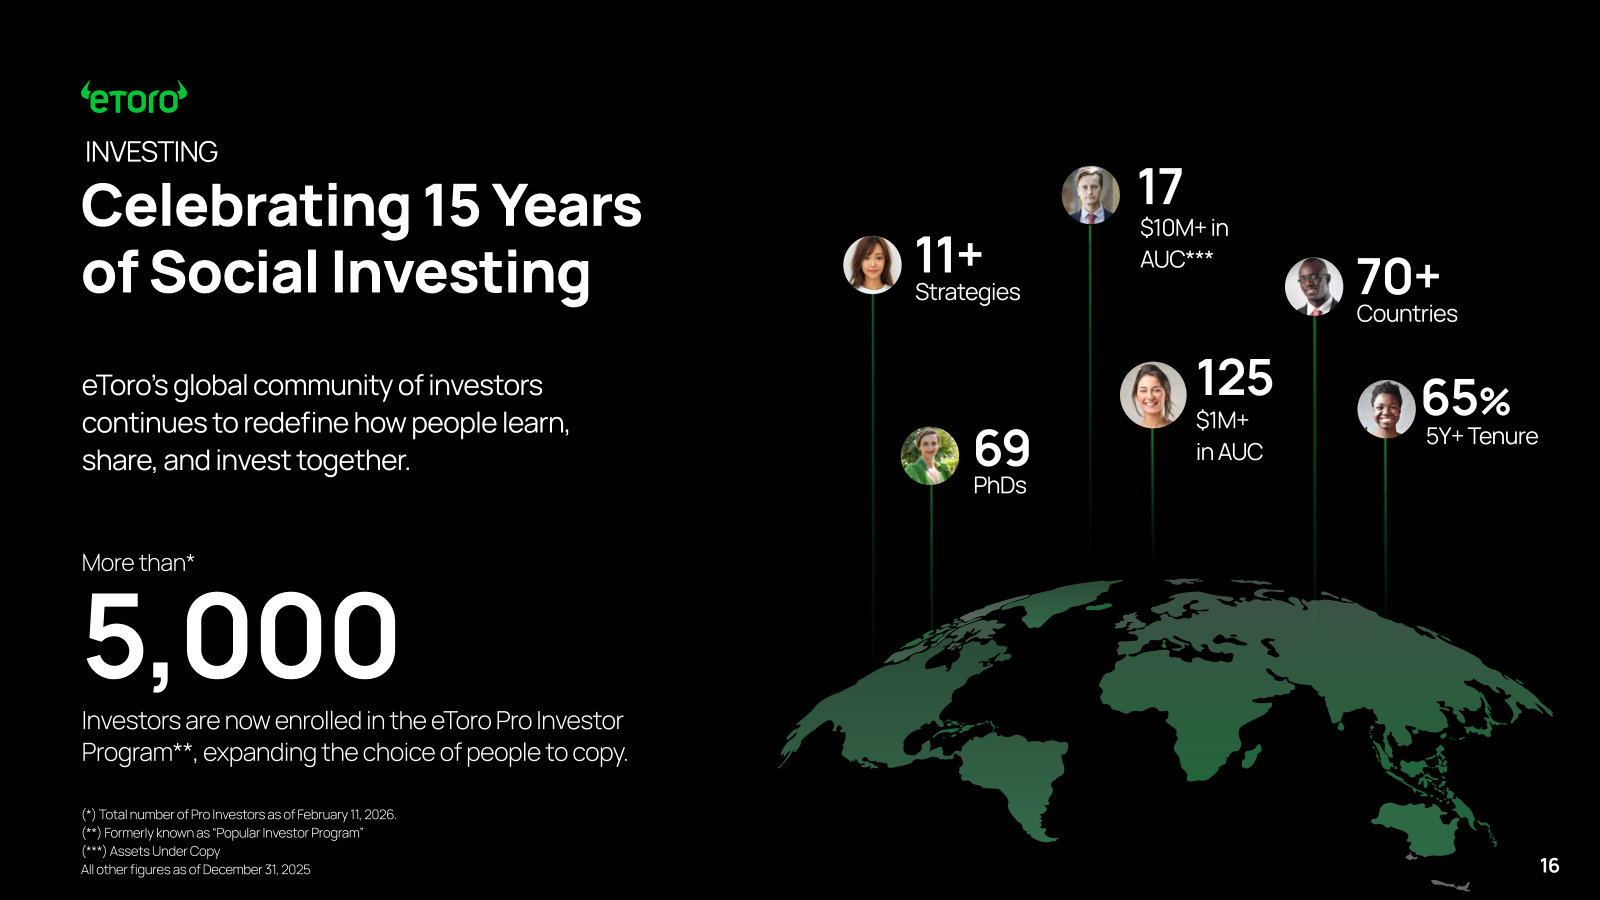
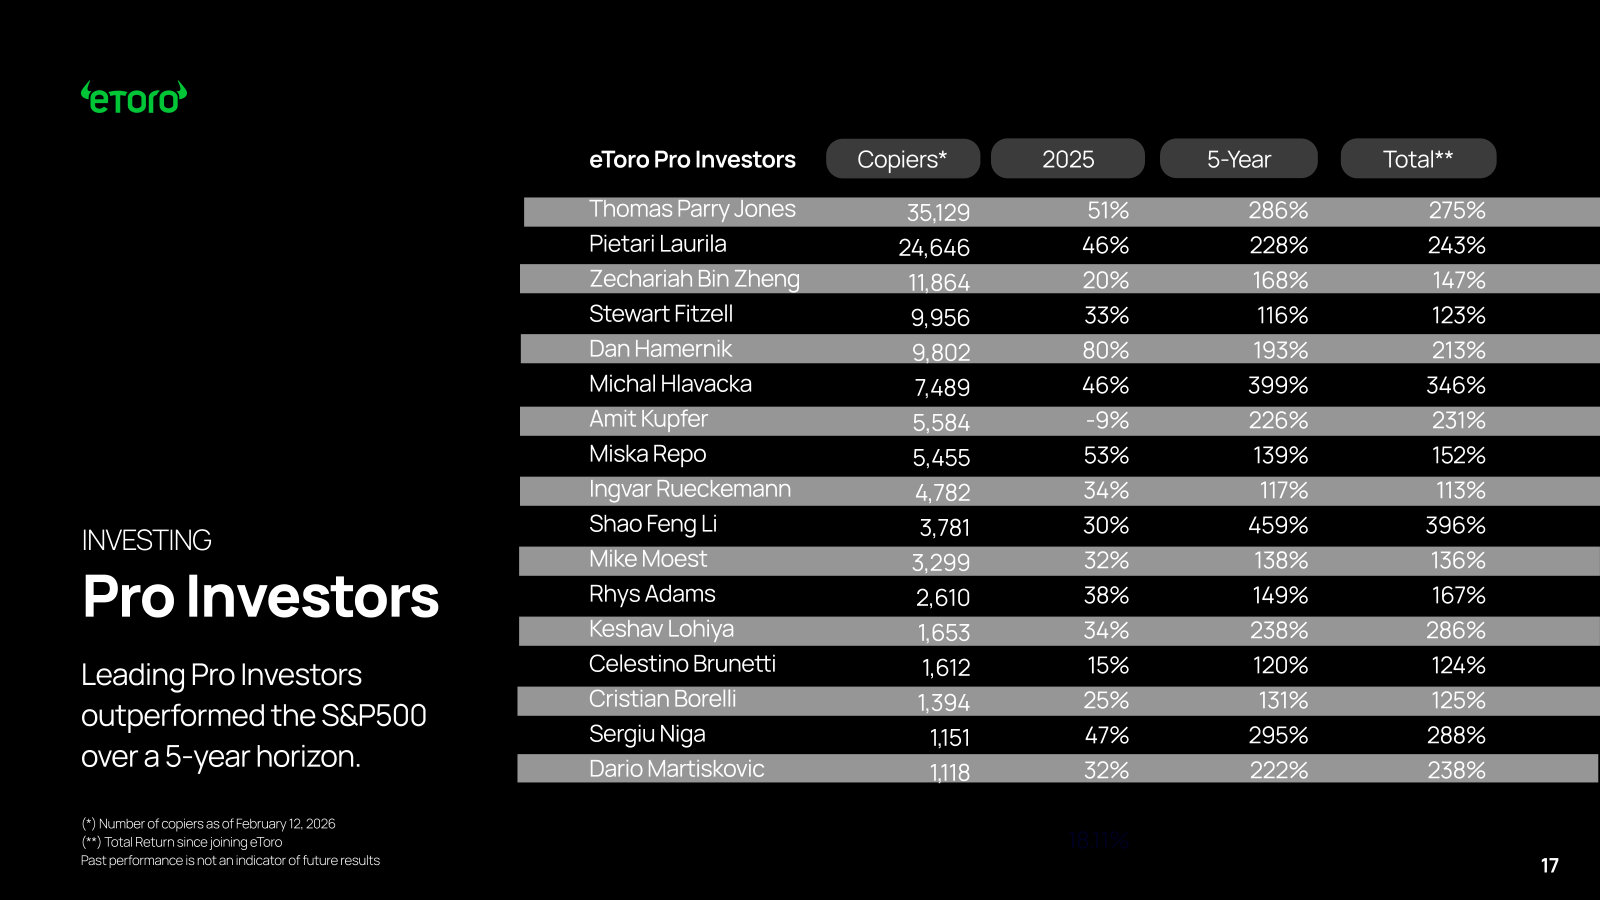
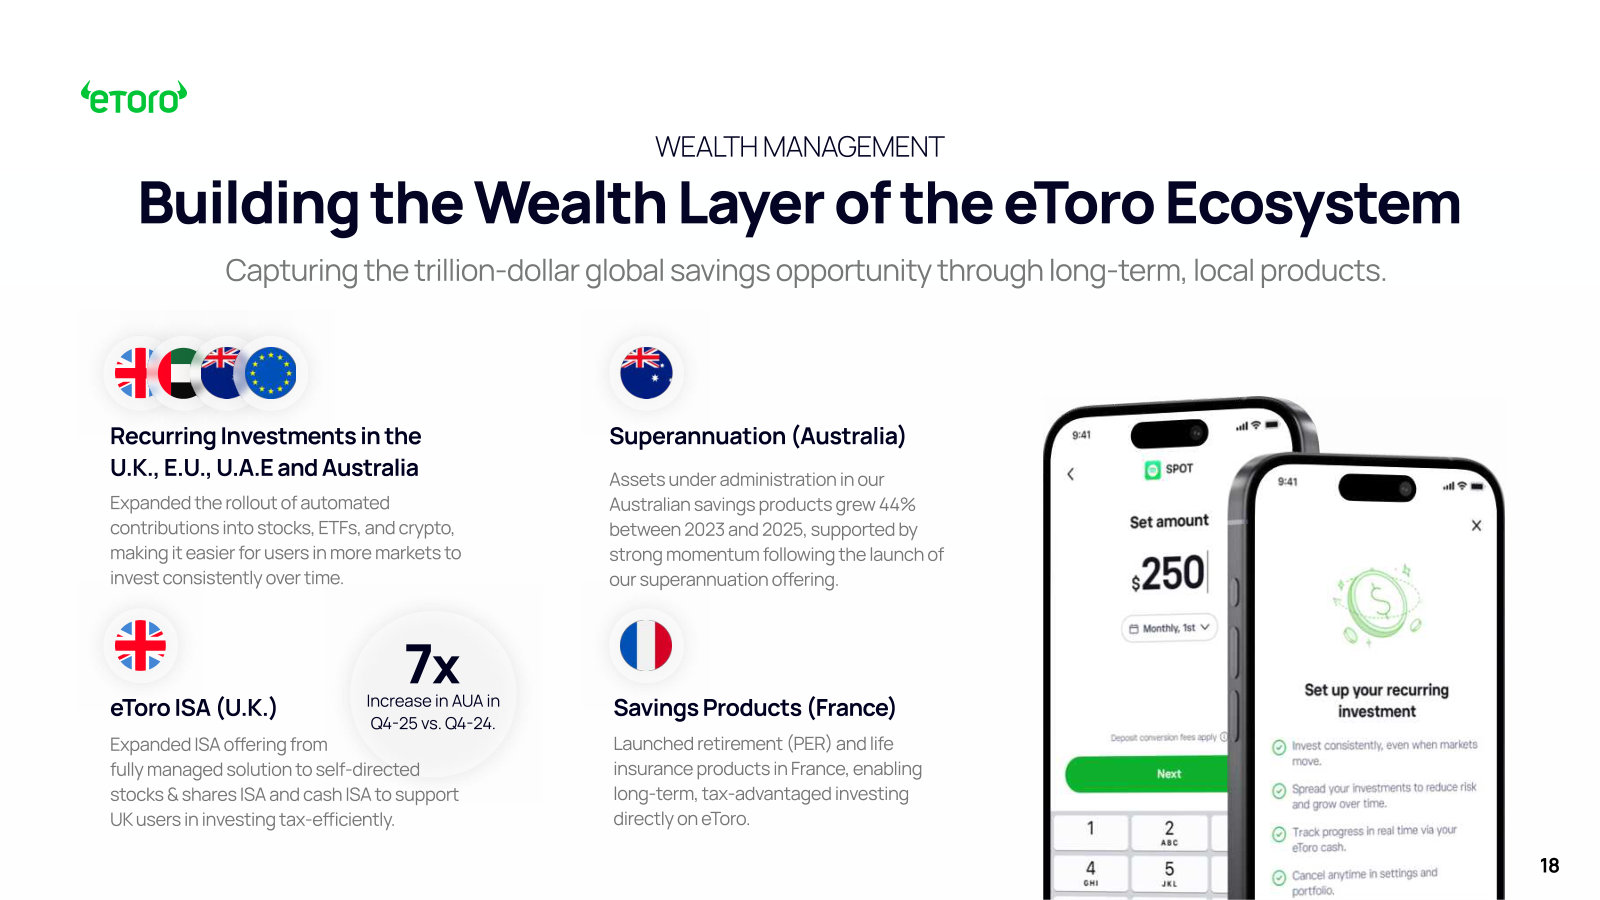
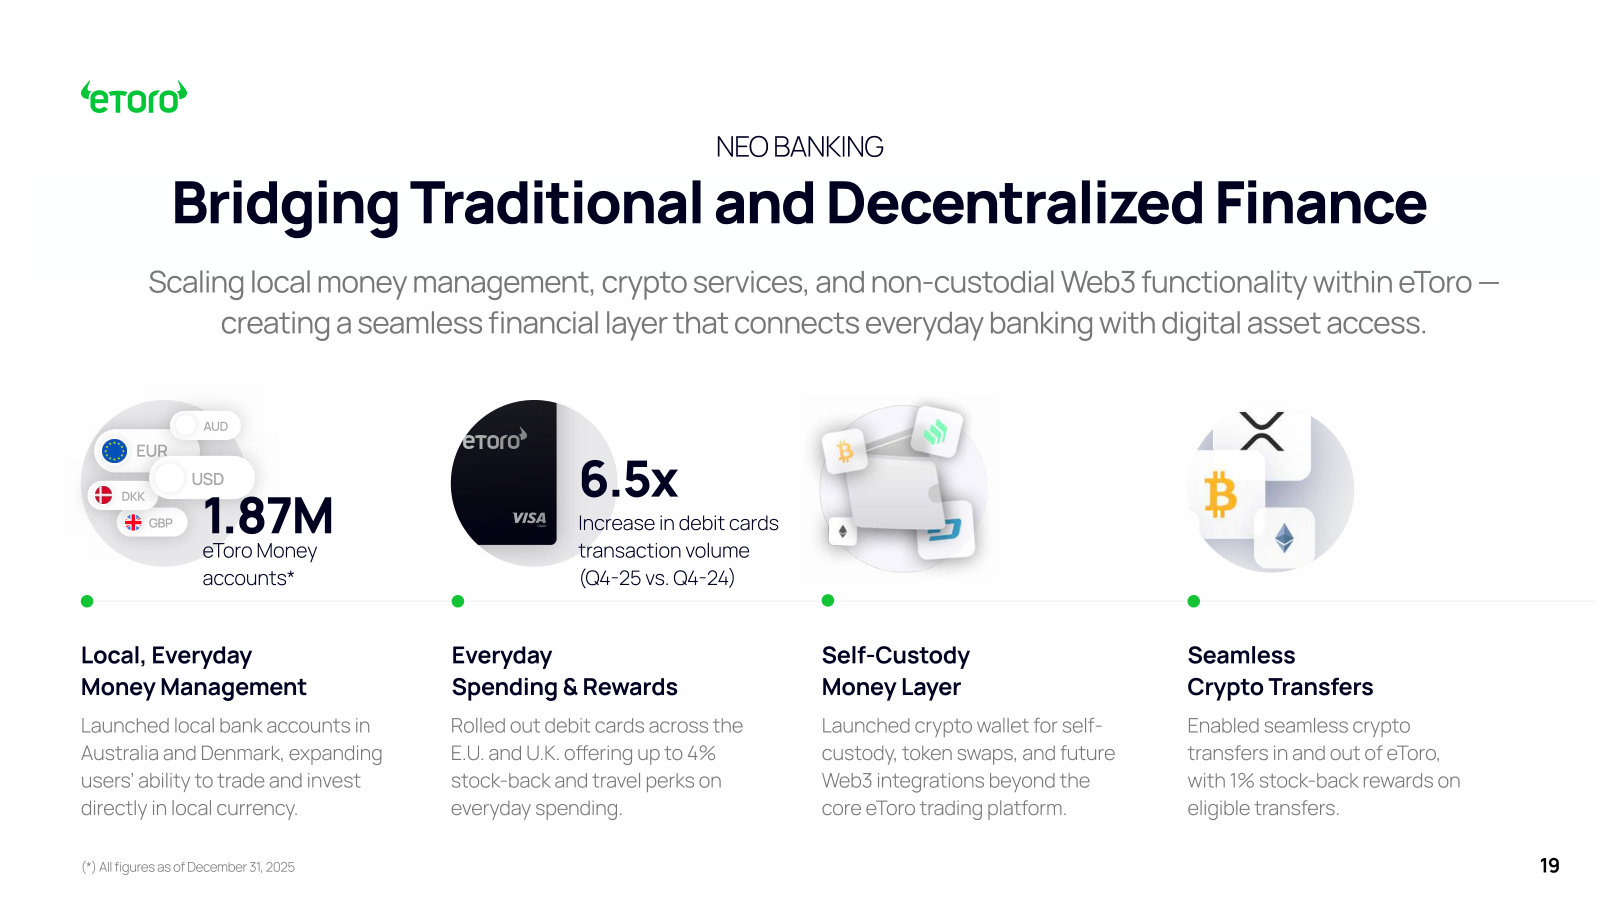
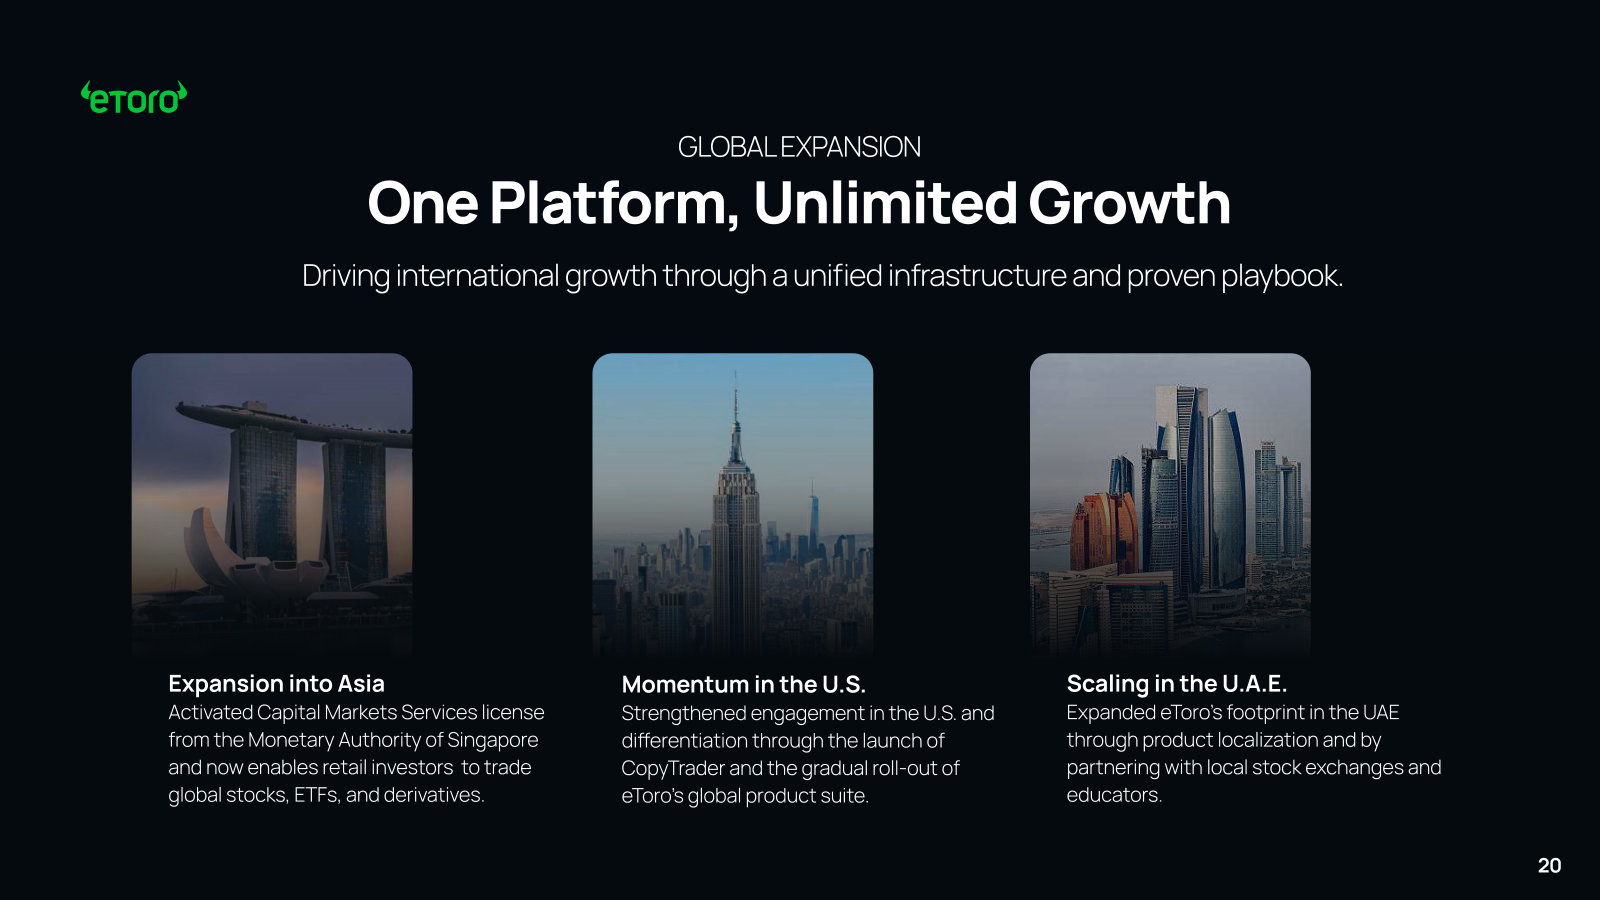
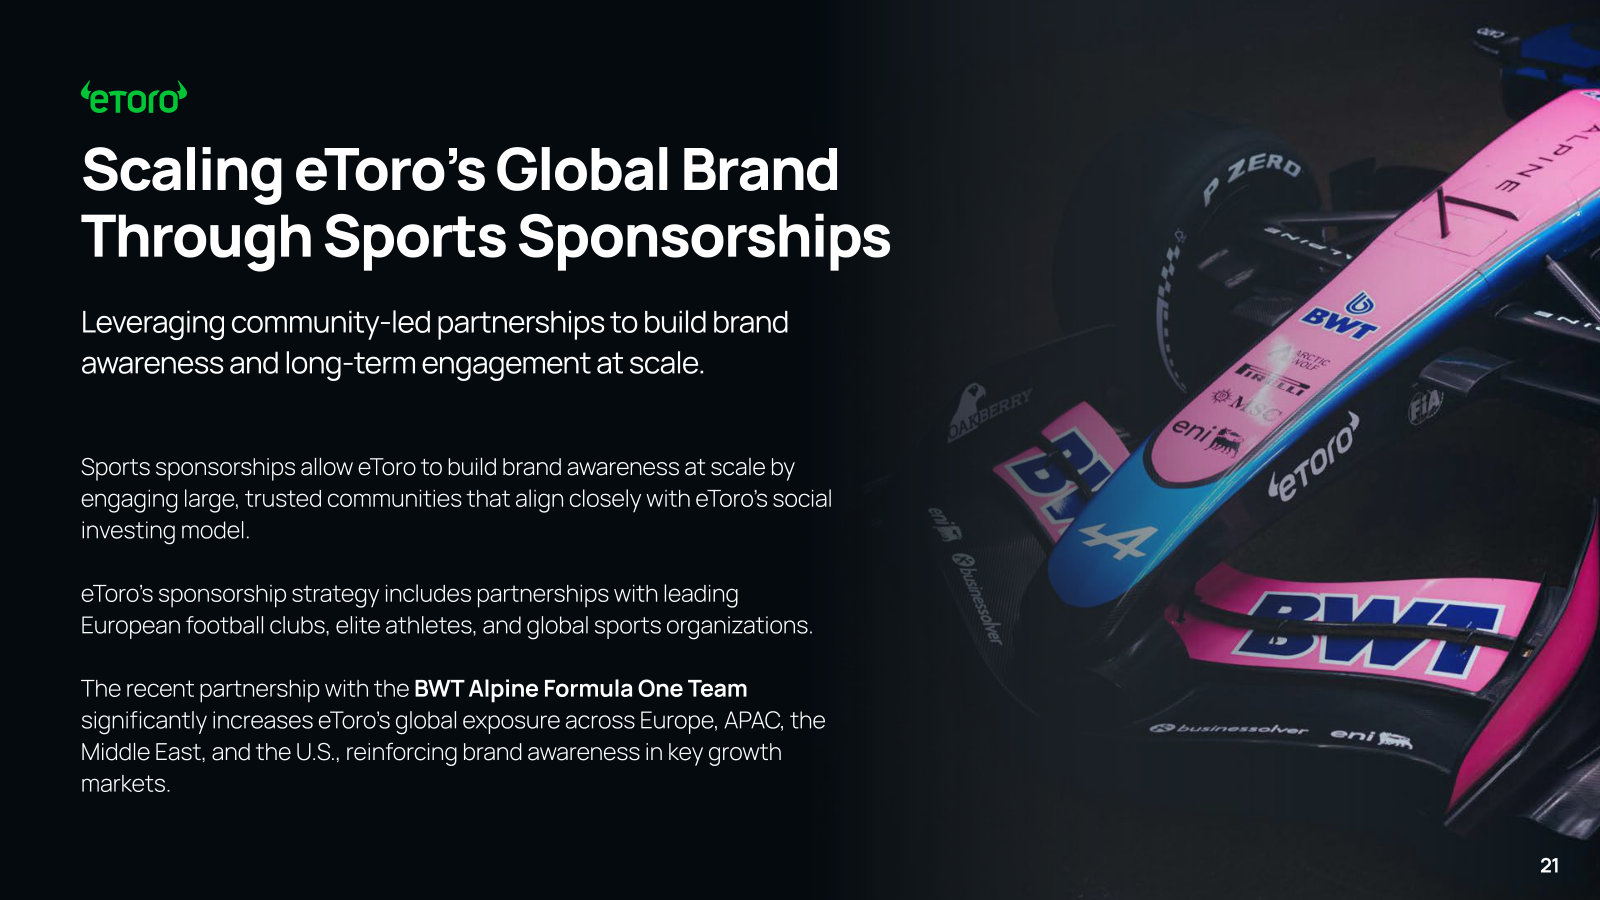
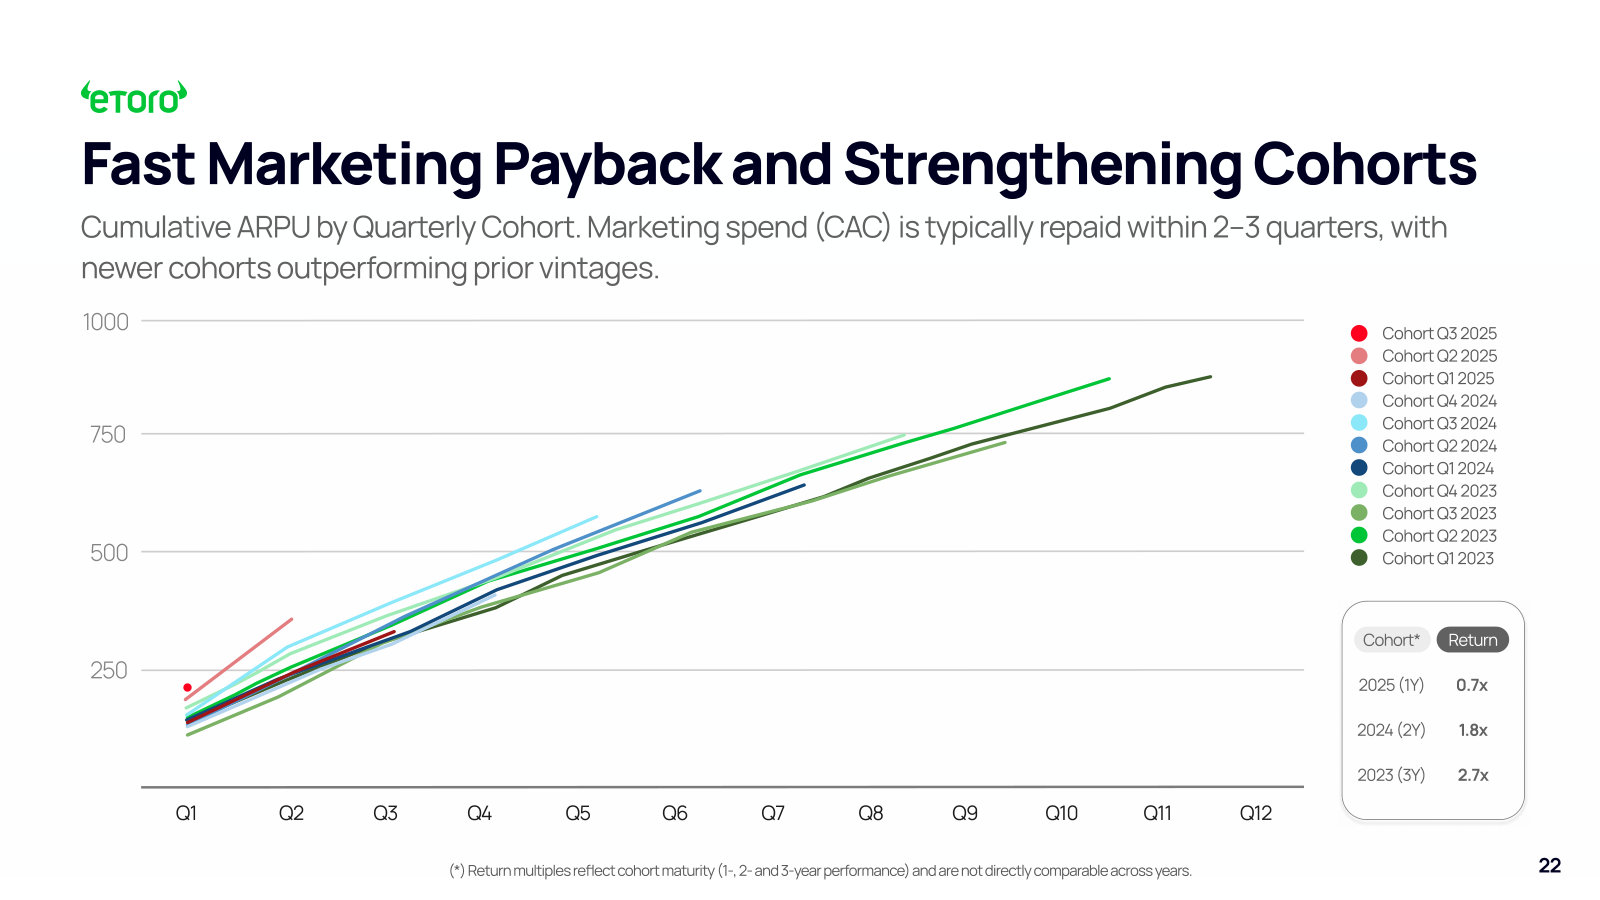
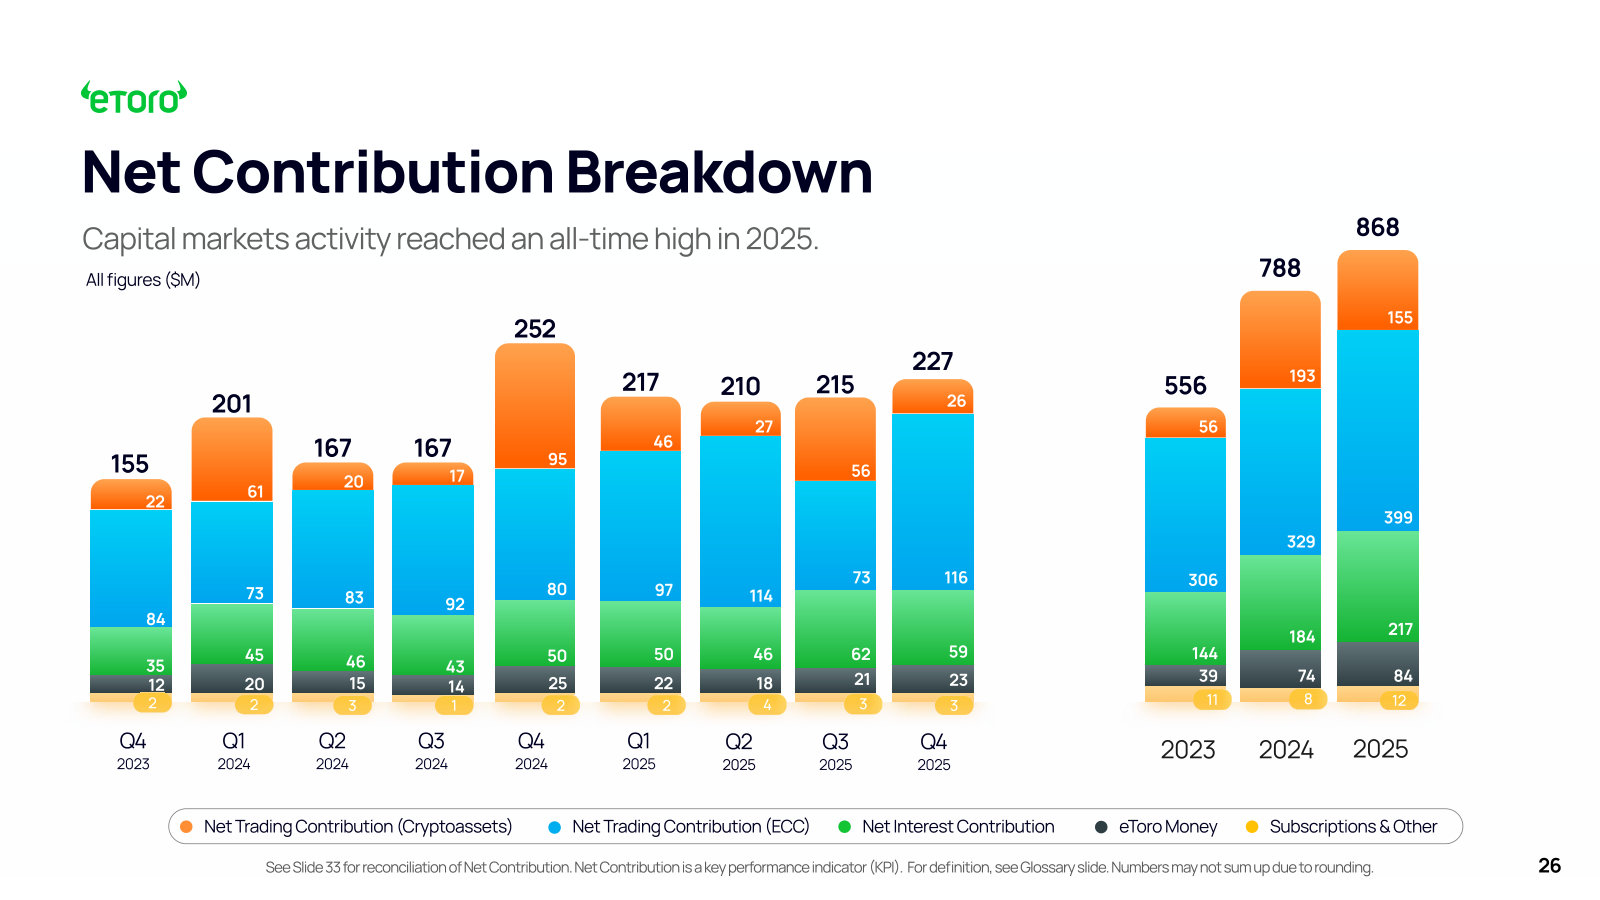
First Quarter 2026 Shareholders Update — Q1 2026
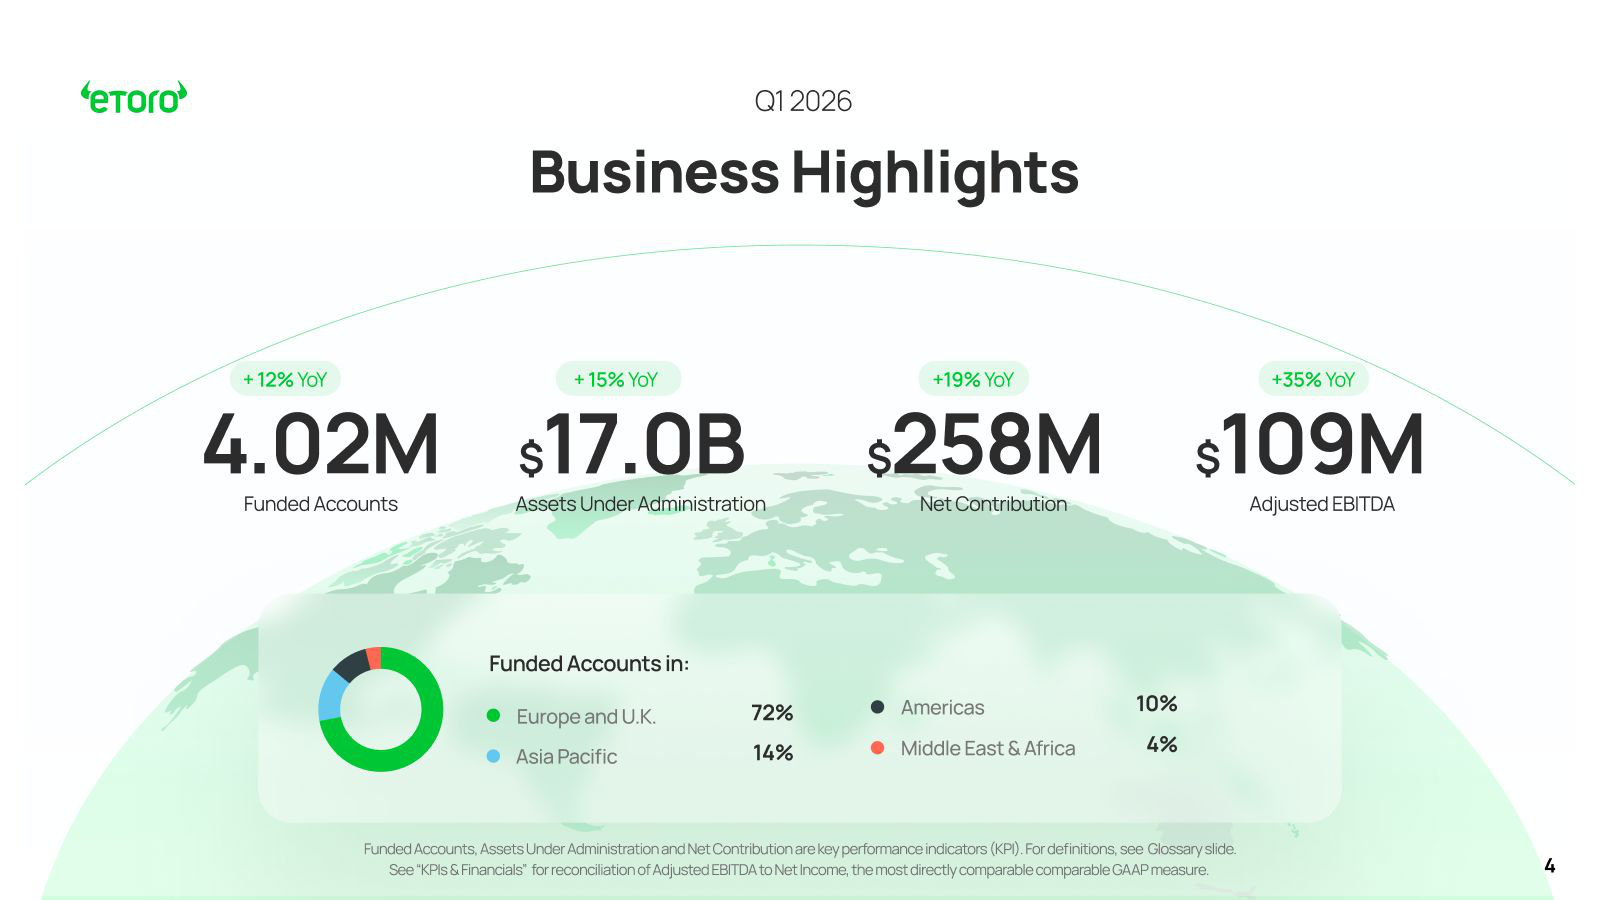
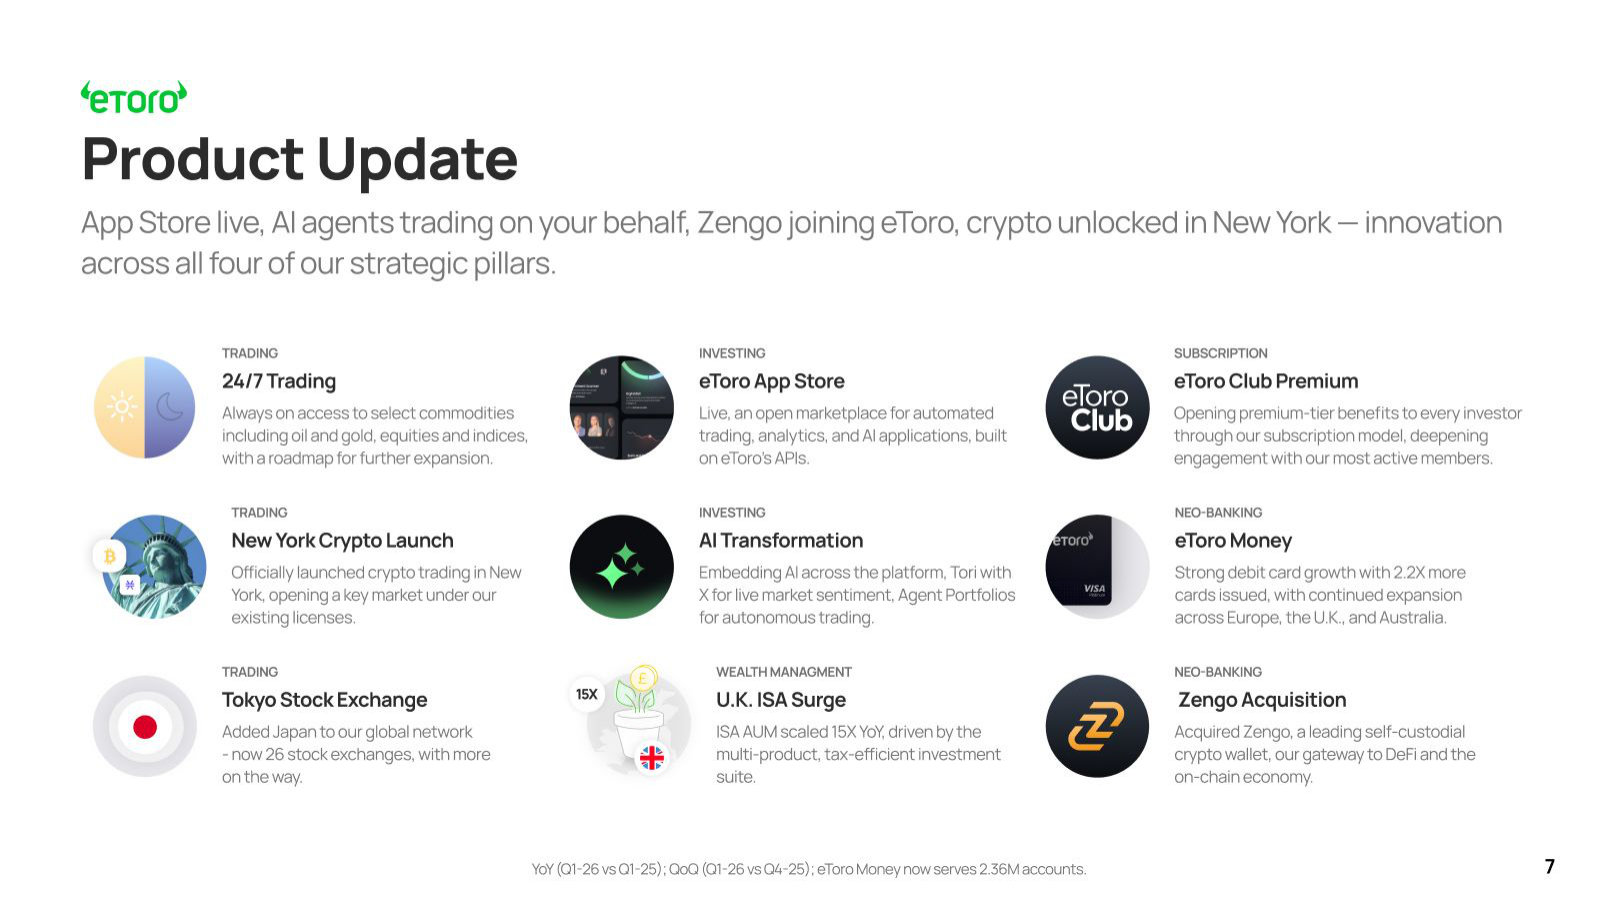
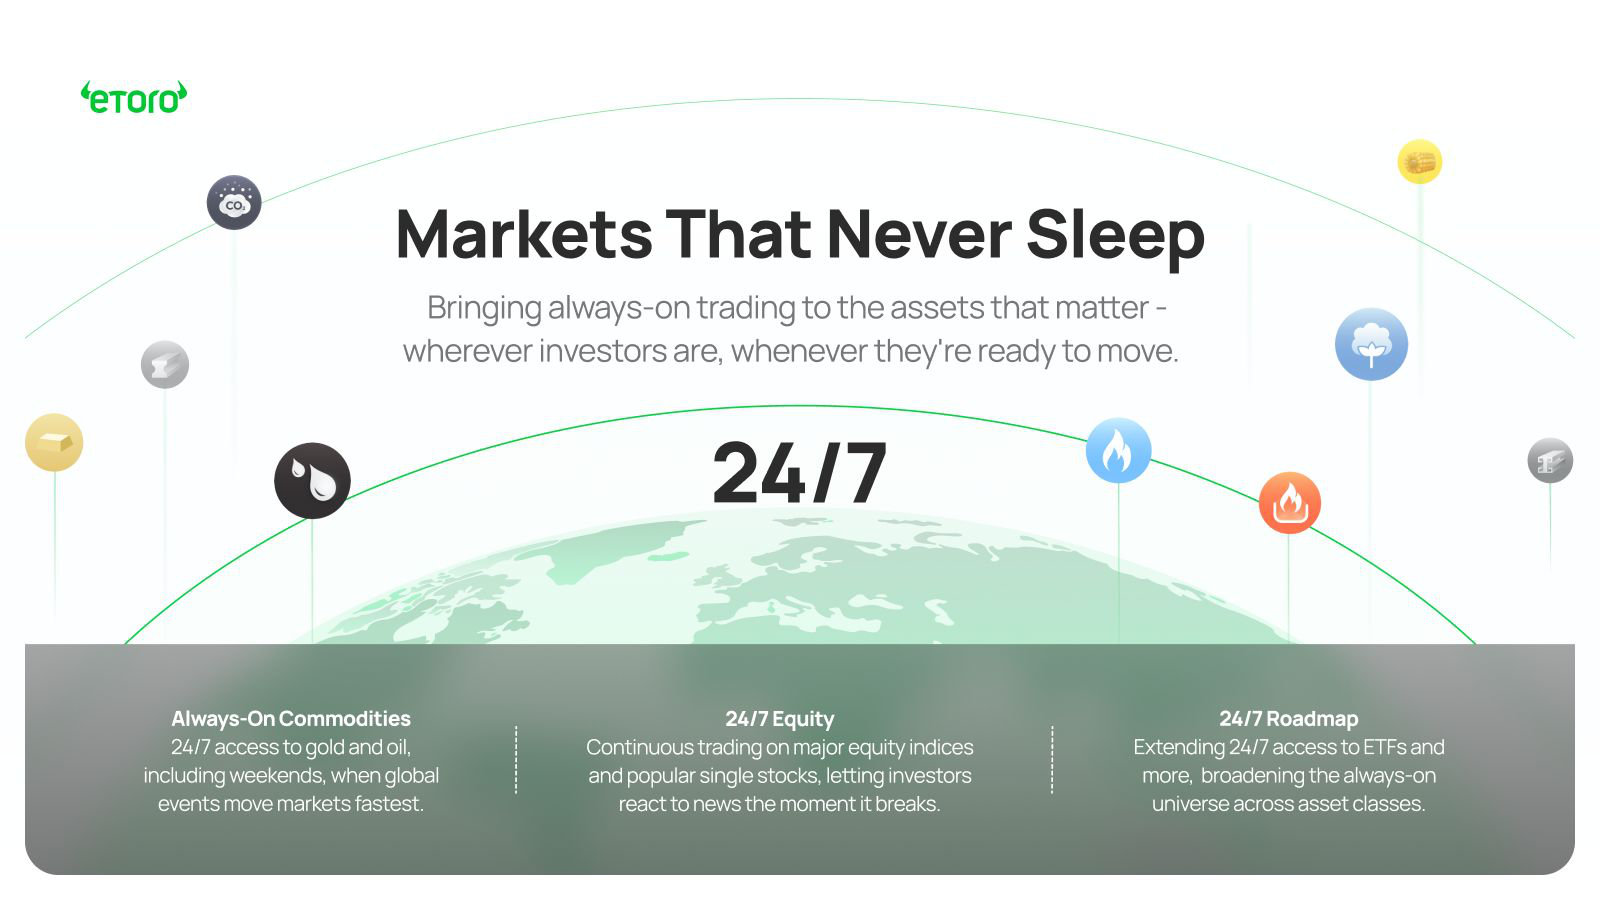
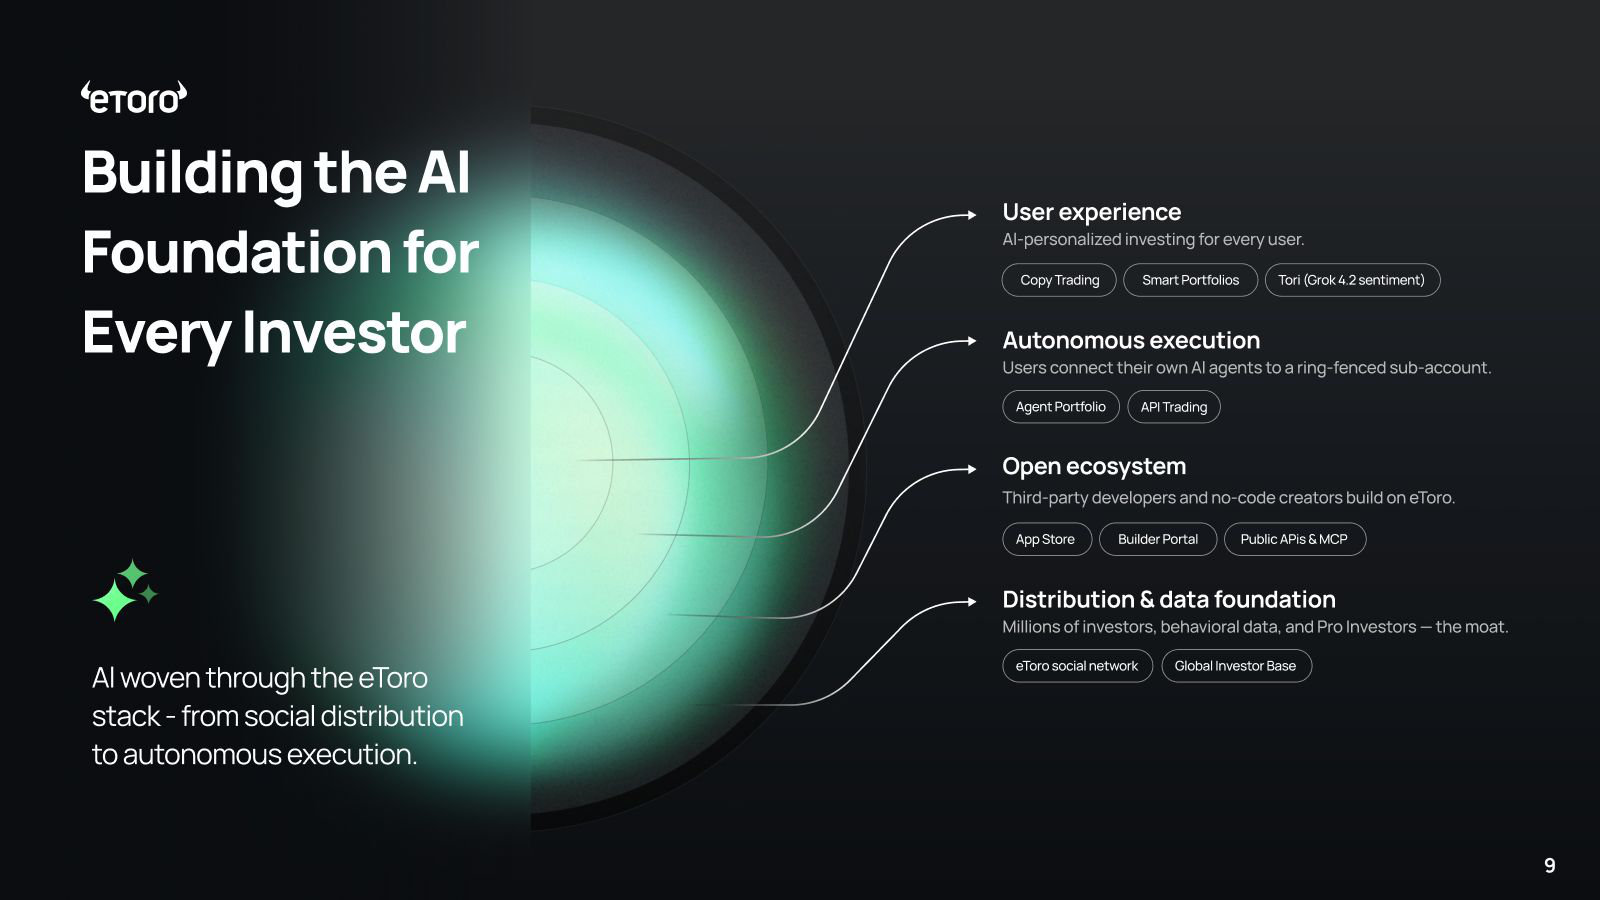
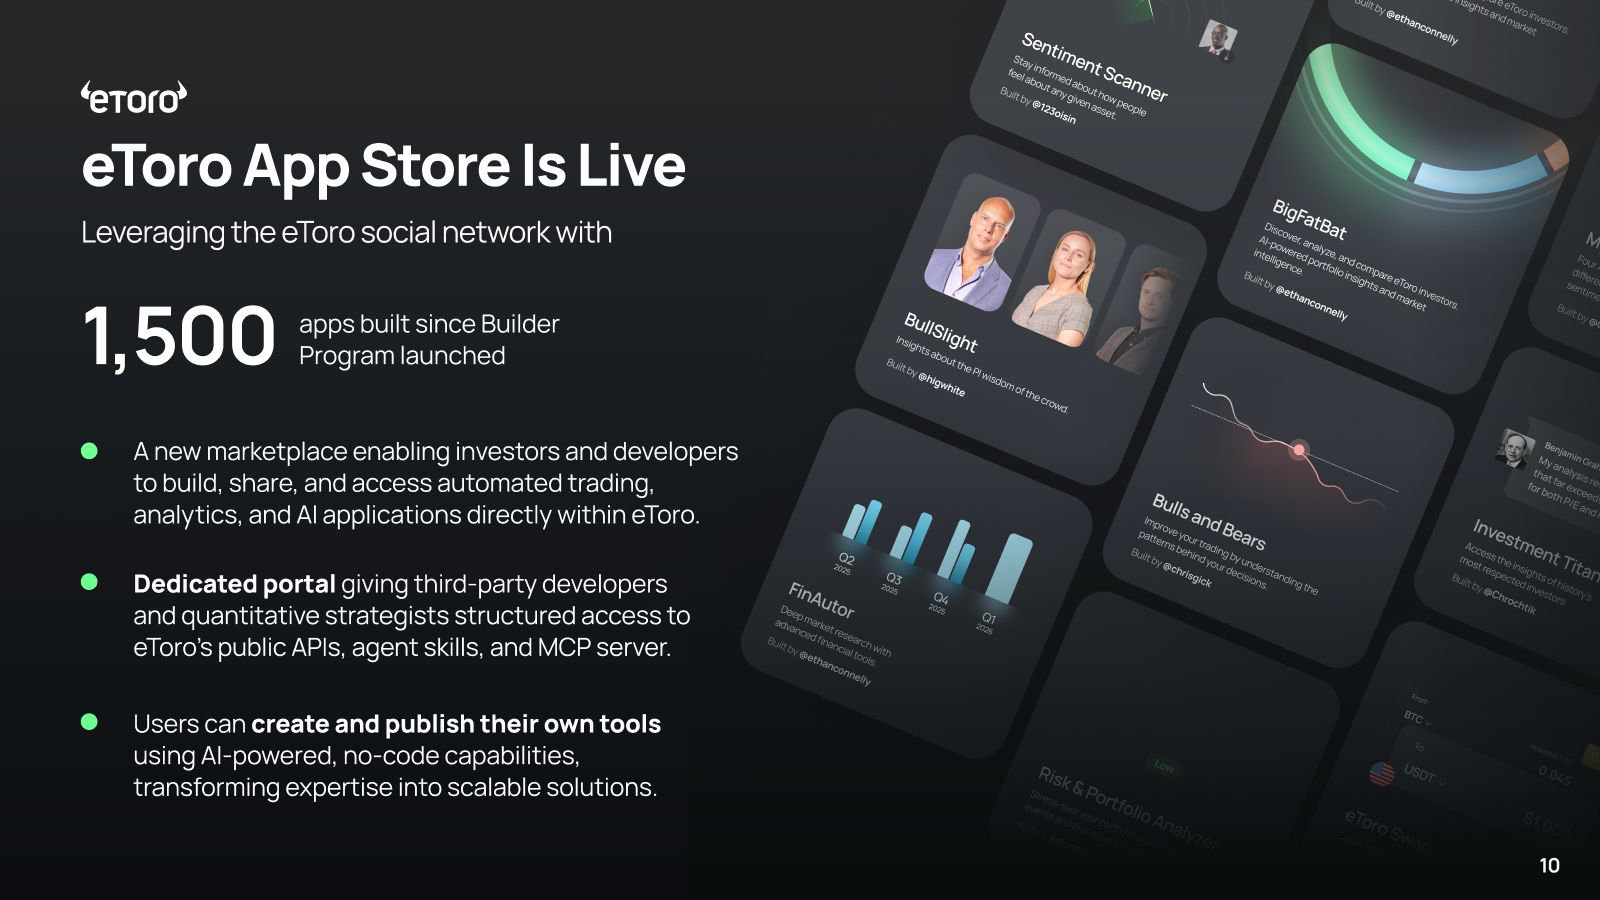
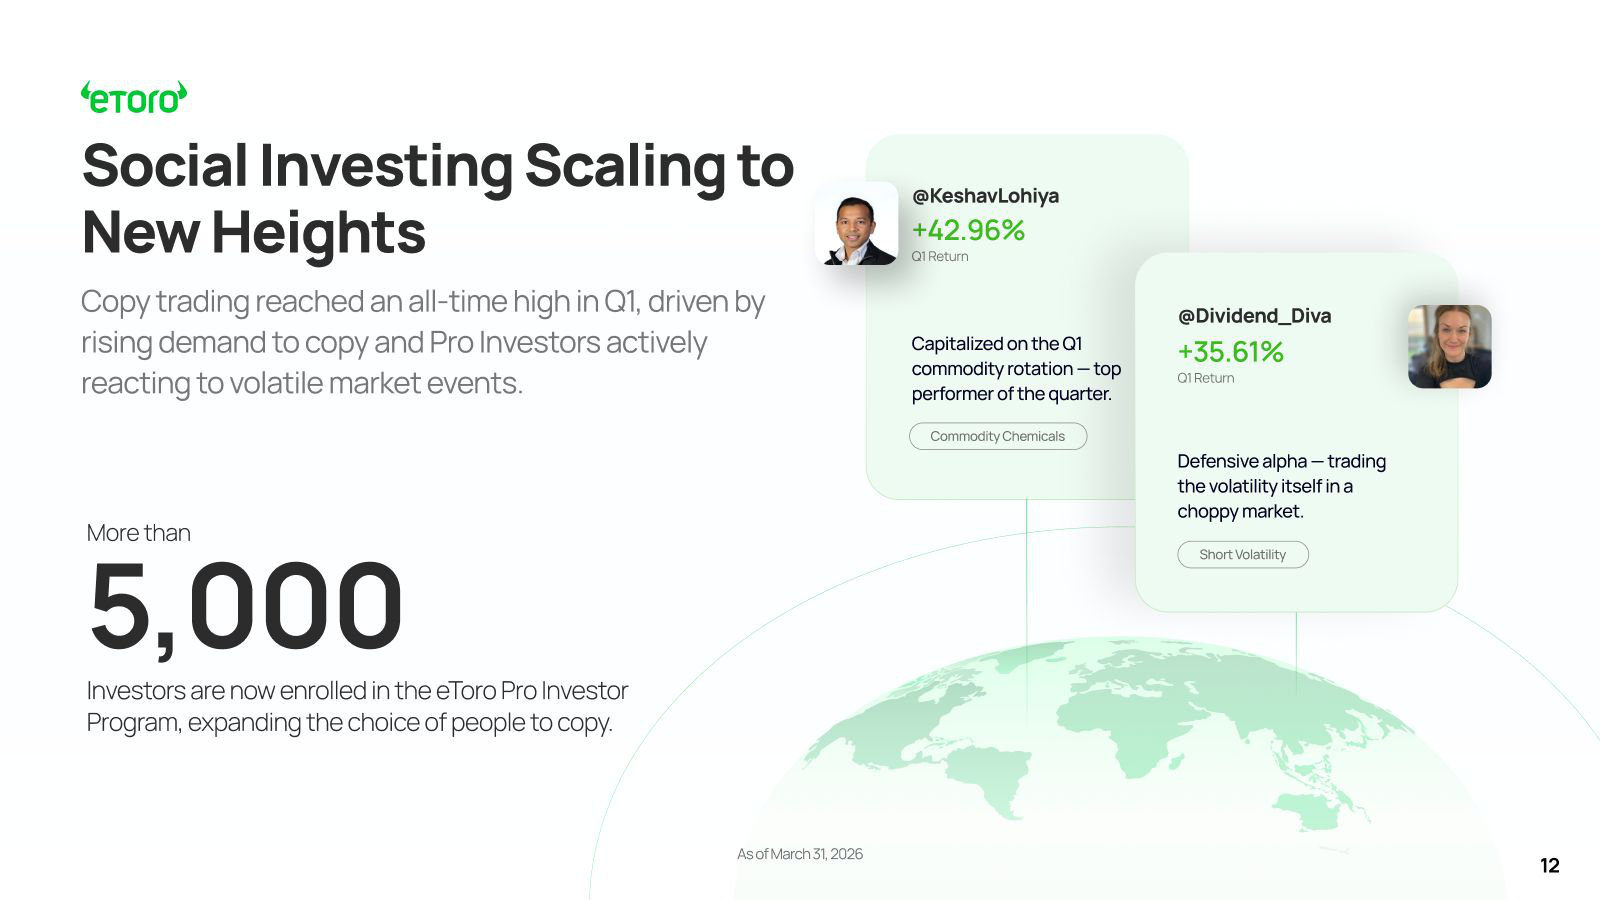
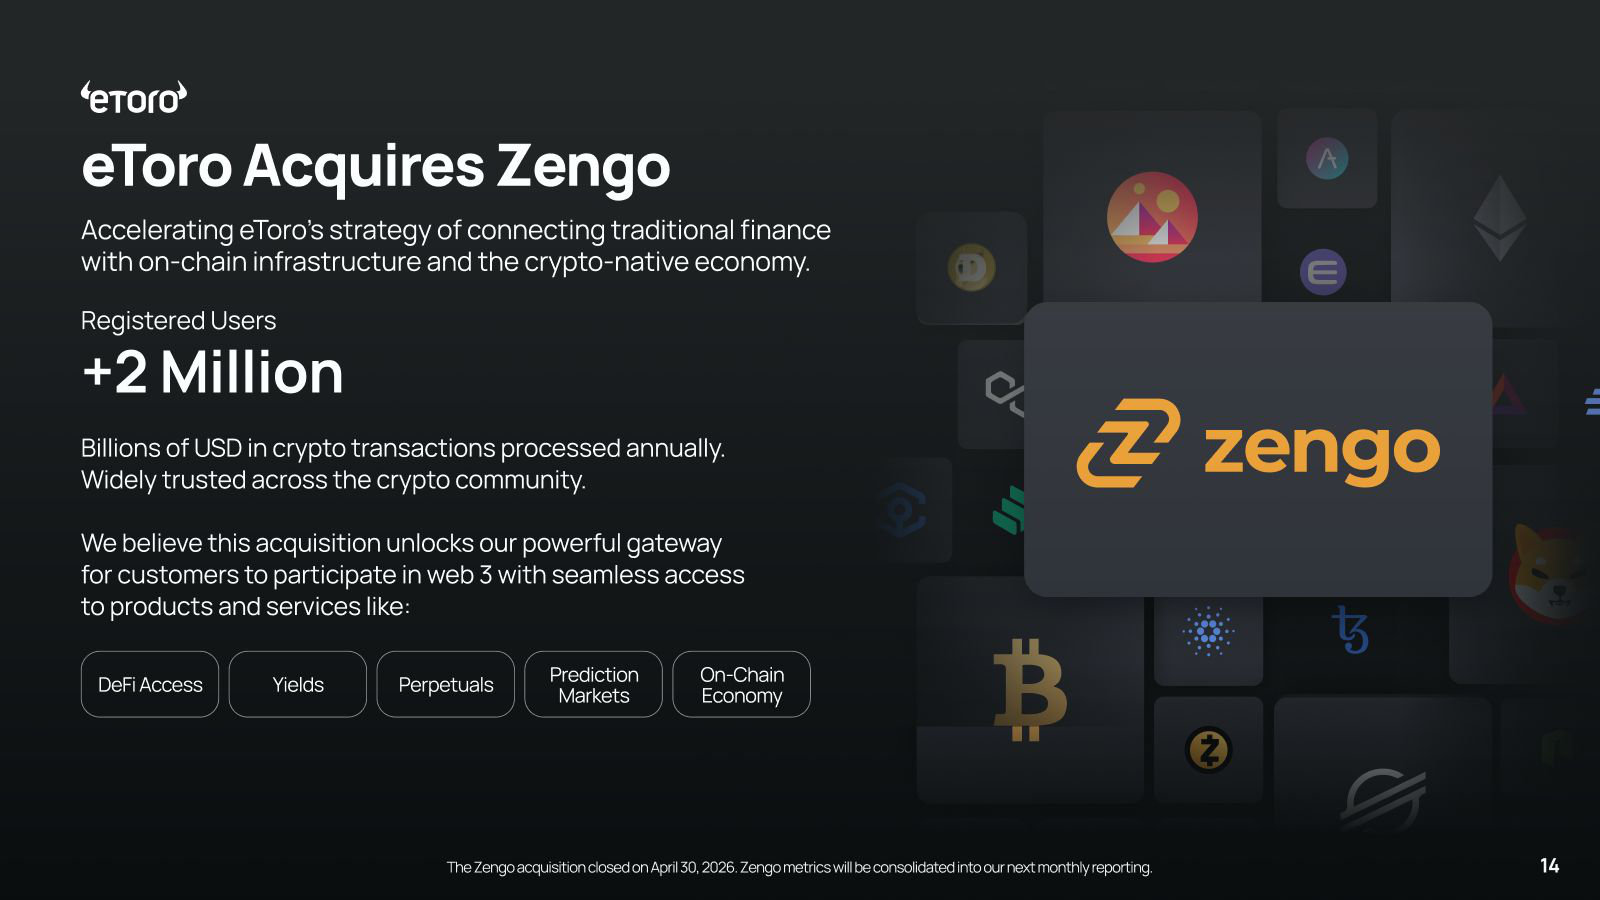
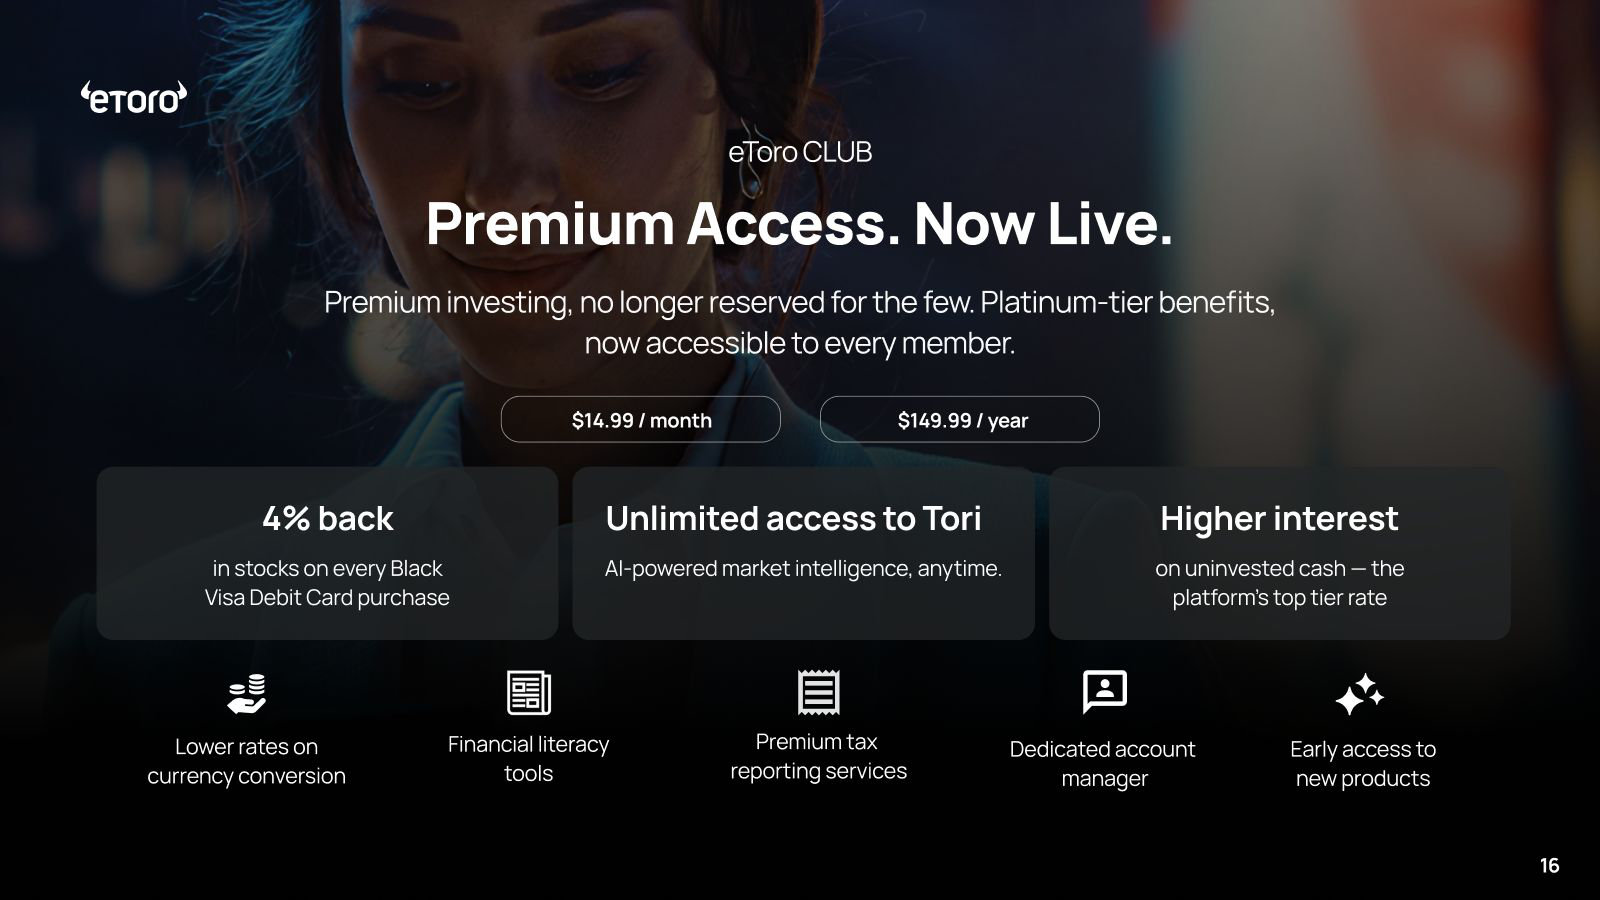
The latest edition — current-quarter numbers plus the developments that post-date the full-year deck: the Zengo acquisition, the App Store going live, the Club subscription and 24/7 AI-driven trading. · Open the full document →


More from management
Third Quarter 2025 Shareholder Update — Q3 2025 · 42 pages · The Q3 2025 read, mid-way between the IPO and the full-year results, for the quarter-by-quarter progression. · Open →
Second Quarter 2025 Shareholder Update — Q2 2025 · 38 pages · The first full quarter as a public company, covering the IPO-related costs and early product launches across the four pillars. · Open →
First Quarter 2025 Shareholder Update — Q1 2025 · 35 pages · The debut post-IPO deck (Q1 2025) — the baseline the later quarters build on. · Open →
eToro Group Ltd.'s management answers for the business every quarter. These are the exchanges that explain it best — verbatim, from the call transcripts preserved in Sources. Each link opens the full transcript at that page in a new tab.
Q1 FY2026 Earnings Call — Q1 FY2026
The freshest read: a record quarter that confirms the multi-asset model as trading rotates out of crypto, and where the new AI-agent product line and capital-allocation posture get their fullest airing. · Open the full transcript →
Four straight strong quarters as a public company; the diversified model holds as trading rotates crypto to commodities.
Yoni Assia (Founder & CEO): This marks our fourth consecutive strong quarter since becoming a public listing. […] the quarter demonstrates the durability of our model and a confirmation of our strategy as trading continued to shift from crypto to commodities and our diversified offering kept users engaged.
p. 18 · Read in context →
Crypto net contribution falls to $13M, and management frames the cyclicality as expected and absorbed by the platform.
Meron Shani (CFO): Amid crypto market cyclicality, net trading contribution from crypto was $13 million with a year over year decline driven primarily by lower trading activity and customers shifting to trade commodities. As we have seen in prior crypto cycles, these periods of volatility are expected and our diversified business model has demonstrated resilience across market cycles.
p. 22 · Read in context →
The 2026 spending decision, quantified: step marketing from 21% toward 25% of net contribution, funded by cohort ROI.
Meron Shani (CFO): Our adjusted selling and marketing expenses for the quarter was $58 million or 22% of net contribution. As discussed last quarter, given the strength of our cohort returns and our objective to accelerate growth in 2026, we plan to increase our sales and marketing investment from 21% last year, scaling gradually to 25% of net contribution this year.
p. 23 · Read in context →
The agentic thesis in one line: AI as the tool that moves retail investors from beta to alpha.
Yoni Assia (Founder & CEO); Devin Ryan (Citizens): When you think of the capabilities today of AI that are in the hands of hundreds of millions of people, AI really levels the playing field for people to actually trade algorithmically. […] Retail customers actually were very good at finding beta and investing in the markets over time, and beta of retail actually was quite good, whether it's crypto or tech stocks. Over the past five years, I think agentic tools enable retail investors to actually also participate and find alpha in a much more meaningful way.
p. 27 · Read in context →
Capital allocation with over a third of market cap in cash: the crypto downturn as an M&A window, alongside continued buybacks.
Yoni Assia (Founder & CEO); Devin Ryan (Citizens): We have a very, very strong M and A pipeline. So we've been in the business soon 20 years, we know hundreds of companies in this space and we actually do believe that the fact that currently crypto is in a downturn provides us the opportunity to find significant and accretive M and a opportunities in 2026. So we have a very good pipeline. That's why we keep the optionality and in parallel, as we said in the past, we believe in buybacks as a company and we'll continue to explore that in relation, of course, to the company's cash flow.
p. 28 · Read in context →
Q4 FY2025 Earnings Call — Q4 FY2025
The full-year call where the thesis was tested: crypto contribution fell 72% yet the diversified model still grew, and management responded by leaning in with more marketing and a bigger buyback. · Open the full transcript →
The multi-asset thesis, stated in a crypto downturn: built since 2013 to perform in any market condition.
Yoni Assia (Founder & CEO): We achieved these results despite the current crypto market environment, underscoring the strength of our multi-asset model and the benefits of our global diversification across geographies and asset classes. […] We first offered crypto trading on eToro in 2013, and since then, we've been through several crypto market cycles. We've seen people right off crypto, we've kept building. Over time, we have built a truly global multi-asset platform, spanning crypto, equities, commodities and currencies. That breadth allows us to adapt as market activity shifts and to perform in any market condition.
p. 7 · Read in context →
The thesis tested in numbers: crypto contribution down 72% year over year, but capital markets up 43% on the rotation into commodities.
Meron Shani (CFO): Net rating contribution from capital markets, including equities, commodities and currencies, increased 43% year-over-year to $116 million driven by investor rotation between crypto and traditional asset classes with particularly strong performance in commodities. This pattern is consistent with historical behavior and highlights the strength of our diversified multi-asset platform. In contrast, net trading contribution from crypto declined 72% year-over-year to $26 million
p. 13 · Read in context →
Leaning into the cycle: raising marketing toward 25% of net contribution from a position of ROI confidence.
Meron Shani (CFO): Given the strength of our cohort returns and our objective to accelerate growth in 2026, we plan to increase our sales and marketing investment from 21%, scaling gradually to 25% of net contribution. Importantly, this spend remains highly flexible and can be adjusted based on market conditions and performance. […] We are making this decision from a position of confidence as the ROI profile supports incremental investment, and we expect this increased spend to drive accelerated growth across our key KPIs in the year ahead.
p. 14 · Read in context →
Buyback scaled up: $59.5M repurchased in Q4, total authorization raised to $250M with $100M deployed to date.
Meron Shani (CFO): In the fourth quarter, we repurchased 1.5 million shares with $59.5 million pursuant to our previously communicated share repurchase program. […] we announced an additional $100 million authorization under our share repurchase program, increasing total authorization to $250 million. To date, we have deployed $100 million under the program.
p. 14 · Read in context →
Q3 FY2025 Earnings Call — Q3 FY2025
The capital-return turn: the first buyback on an 'undervalued' stock, the crypto up-cycle in full swing, and the clearest explanation of the cross-asset rotation engine. · Open the full transcript →
CopyTrader as the flagship moat: the top pro investor scaled $50M to $250M in a year, and the product launches in the US.
Yoni Assia (Founder & CEO): over 130 pro investors now have north of $1 million assets under management with our top Pro Investor growing from $50 million to over $250 million in 2025 alone, a milestone that reflects the growth and influence of our Pro Investor Program. […] Last month, we launched Copy Trading in the U.S. We’re excited to bring our flagship product to the world’s largest capital market. Copy Trading today is experienced across approximately 1/3 of our users.
p. 3 · Read in context →
The first buyback: $150M authorized on a stock management calls undervalued, with cash left over for M&A.
Yoni Assia (Founder & CEO): we announced today a $150 million share repurchase program, underscoring our confidence in eToro’s long-term growth prospects and our continued commitment to delivering value for shareholders. We believe that our stock is undervalued. And given our significant cash generation, we have the flexibility to buy back shares. Our strong cash position also gives us the ability to consider M&A opportunities to drive inorganic growth.
p. 7 · Read in context →
The crypto up-cycle in numbers: net contribution up 229% year over year to $56M as activity surged in July and August.
Meron Shani (CFO): Our net trading contribution from crypto grew 229% year-over-year to $56 million, which was largely driven by higher invested amount per trade and increased crypto activity, especially in the month of July and August.
p. 7 · Read in context →
A disclosure upgrade for a young public company: monthly KPIs and a historical spreadsheet built for modeling.
Meron Shani (CFO): Consistent with our commitment to greater transparency and enhanced disclosure, we will now begin publishing KPIs on a monthly basis. We’ve also made a detailed spreadsheet available on our website, which includes historical monthly data to help investors better track our performance over time. Our goal is to provide the investment community with the information and tools needed to more clearly understand, model and evaluate our business.
p. 8 · Read in context →
Hard question — why not just defend Europe? The data-driven CAC-to-LTV answer on where marketing capital goes.
Yoni Assia (Founder & CEO); Craig Siegenthaler (Bank of America): But eToro has leading share in Europe with some scale. And this market also looks a lot less competitive than the U.S. and Asia. So my question is, why not focus on your first-mover advantage in Europe […] when we drive our marketing and most of our marketing is a data-driven performance marketing approach, we always look at basically the ratio between CAC to LTV. So when we have a strong region, and obviously, Europe — some of our strongest regions in Europe, UAE, Australia as well, we’re actually doubling down on growth there as well. […] So we are definitely focused on maintaining our leadership in Europe in the retail brokerage industry.
p. 11 · Read in context →
The engine explained: across eight quarters, strength in one asset class pulls activity from the others.
Yoni Assia (Founder & CEO); Brett Knoblauch (Cantor Fitzgerald): when you look at our numbers in the last 8 quarters, and you see that in the investor presentation, what we’ve seen over time is very clear. When one asset class is very strong, we see a shift towards that asset class from other asset classes. So every time crypto has a very strong momentum, we actually see the non-crypto revenues or capital markets revenue actually going down a bit. And then as crypto goes down, we see capital markets significantly shift higher as well. And that is a dynamic that we did see in Q3.
p. 12 · Read in context →
Q2 FY2025 Earnings Call — Q2 FY2025
The first call as a public company — the best single place to learn what eToro is, how it makes money, and the financial philosophy management runs it by. · Open the full transcript →
Zero to understanding: what eToro is — multi-asset access across 75 countries, with patented CopyTrader at the core.
Yoni Assia (Founder & CEO): On eToro's platform, users can invest in stocks for more than 20 different stock exchanges and trade over 130 different crypto assets alongside indices, commodities and currencies. […] We serve customers in 75 different countries and 20 different languages, users can trade directly, invest in a portfolio or use our patented CopyTrader technology to replicate the investment strategies of the top investors on our platform.
p. 3 · Read in context →
The CFO's financial philosophy in three pillars: revenue diversification, growth investment, and cost discipline.
Meron Shani (CFO): Our philosophy is focused on sustainable, profitable revenue growth, which is supported by three pillars. First, diversification of revenue streams to complement transaction-based revenue, with a focus on growth in asset-based revenues, expansion of our eToro Money offering and the introduction of new revenue streams. Second, strategic investment to support growth in funded accounts and increase our share of the user's wallet […] And third, disciplined cost management.
p. 6 · Read in context →
The marketing model: about 70% of spend is dynamic, historically returning positive ROI within the first year.
Meron Shani (CFO): Our business model provides us flexibility in our selling and marketing expenses, where approximately 70% of our expense is dynamic. Our historical performance has proven that our marketing expense has consistently returned positive ROI within the first year of the investment and sustained commission growth over time.
p. 7 · Read in context →
The tokenization thesis: $100 trillion of assets expected to move on-chain, with eToro positioned as the bridge.
Yoni Assia (Founder & CEO); Devin Ryan (Citizens): I believe that the digitization and tokenization of assets is a very significant process that will take time but we do expect $100 trillion of assets over the next years to move on chain, now quoting the SEC Chairman talking about moving U.S. capital markets on chain. […] We already support stocks from 22 different capital markets as tokenization happens across stock markets, bond markets and potentially real estate.
p. 10 · Read in context →
Hard question on organic growth after a soft +1.4% q/q; the answer leans on customer quality and +34% account size.
Meron Shani (CFO); Craig Siegenthaler (Bank of America): Funded account growth was 1.4% quarter-overquarter. […] And I know M&A has aided your account growth rate historically, but I wanted your perspective on the organic trend. […] So we have proven in the last few years that we are able to grow our funded accounts on a double digits on a yearly basis. […] However I could definitely say that we see a better quality of customers. They bring more share of their wallet onto the platform. […] And we could also note about the average account size that grew 34% year-on-year, thanks to customers loading more of their share of the wallet as well as market gains.
p. 12 · Read in context →
eToro Group Ltd.'s annual reports contain management's most considered account of the business. These are the sections, passages and visual pages worth opening in the originals preserved in Sources.
eToro Group Ltd. — FY2025 Annual Report (Form 20-F) — FY2025
eToro's first annual report as a public company (Nasdaq IPO May 2025) — the founder-led social-investing brokerage explaining its multi-asset, crypto-heavy model in full. · Open the full document →
Item 3. Key Information — Risks: CopyTrader, Smart Portfolios and Finfluencers — p. 37 · Read the full section →
eToro's signature social features carry its most distinctive regulatory exposure — U.S. CopyTrader is limited pending FINRA approval.
Copy-trading's regulatory treatment is inconsistent across jurisdictions; U.S. rollout hinges on FINRA.
Our social features, specifically CopyTrader and Smart Portfolios, which allow users to follow and replicate the trading activities of other users or portfolios, respectively, may expose us to certain operational, regulatory and reputational risks. […] In the U.S., CopyTrader is currently only available on a limited basis and we may be required to suspend our offering of CopyTrader if FINRA does not approve a Continuing Membership Application we have filed in connection with the continued launch and operation of the CopyTrader service.
p. 37 · Read in context →
Item 3. Key Information — Risks Related to Cryptoassets and Cryptoasset Markets — p. 44 · Read the full section →
Crypto was 17%–38% of trading commission; results ride bitcoin's price and volume, and a 'security' ruling could force delistings.
eToro's own risk-based test — not a legal standard — decides which cryptoassets it treats as non-securities.
We currently facilitate customer trades for certain cryptoassets that we have analyzed under applicable internal policies and procedures and, for cryptoassets supported on our platform, that we believe are not “securities” under the applicable laws in a relevant jurisdiction. Although we maintain a strict policy and we perform ongoing monitoring and legal review, our policies and procedures do not constitute a legal standard, but rather represent our company-developed risk-based assessment regarding the likelihood that a particular cryptoasse could be deemed a “security” under applicable laws. In the event that we determine that a supported cryptoasset could be deemed a security or that the continued support of a cryptoasset presents a risk to us or our users, we aim to take prompt action to discontinue the trading and custody of the cryptoasset. Users that traded a supported cryptoasset on our platform and suffered trading losses could also seek to rescind a trade on our platform on the basis that eToro effected their transactions in violation of applicable law, which could subject us to significant liability.
p. 47 · Read in context →
Item 3. Key Information — Risks Related to Our Operations in Israel — p. 67 · Read the full section →
HQ, founders and much of management sit in Bnei Brak, Israel — concentrating the business in a region prone to armed conflict.
Founders, management and HQ are Israel-based; regional instability could disrupt operations.
Many of our employees, including our founders and certain members of our management team, operate from our headquarters that are located in Bnei Brak, Israel. In addition, a number of our officers and directors are residents of Israel. […] Israel has experienced, and may in the future experience, armed conflicts, terrorist activity, civil unrest, and political instability, which could disrupt our operations and supply chain.
p. 67 · Read in context →
Item 4. Information on the Company — Business Overview — p. 82 · Read the full section →
Management's own account of the social-investing model, the CopyTrader flywheel and the breadth of the multi-asset platform.
Product breadth: 150+ cryptoassets, 127 Smart Portfolios, and 4,750+ copyable Pro Investors.
We provide our users with a gateway to the global financial markets, offering a platform that empowers our users to invest, trade, save and spend in a way that suits their unique needs. On our platform, users can trade equities, commodities, currencies and cryptoassets, traded as the underlying asset or a derivative, depending on the asset class and on the user’s location. On our global platform, users can trade thousands of instruments, including over 150 cryptoassets, 127 curated Smart Portfolios, and copy over 4,750 members of the Pro Investor program.
p. 88 · Read in context →
Item 5. Operating and Financial Review — Our Revenue Model — p. 127 · Read the full section →
How eToro actually makes money across four streams — and why it frames the multi-asset mix as a natural hedge across market cycles.
Four revenue streams: trading income, interest income, money-management fees and value-added services.
We generate revenue through a multifaceted model consisting of (1) trading income, (2) interest income, (3) money management fees and (4) other value-added products and services.
p. 127 · Read in context →
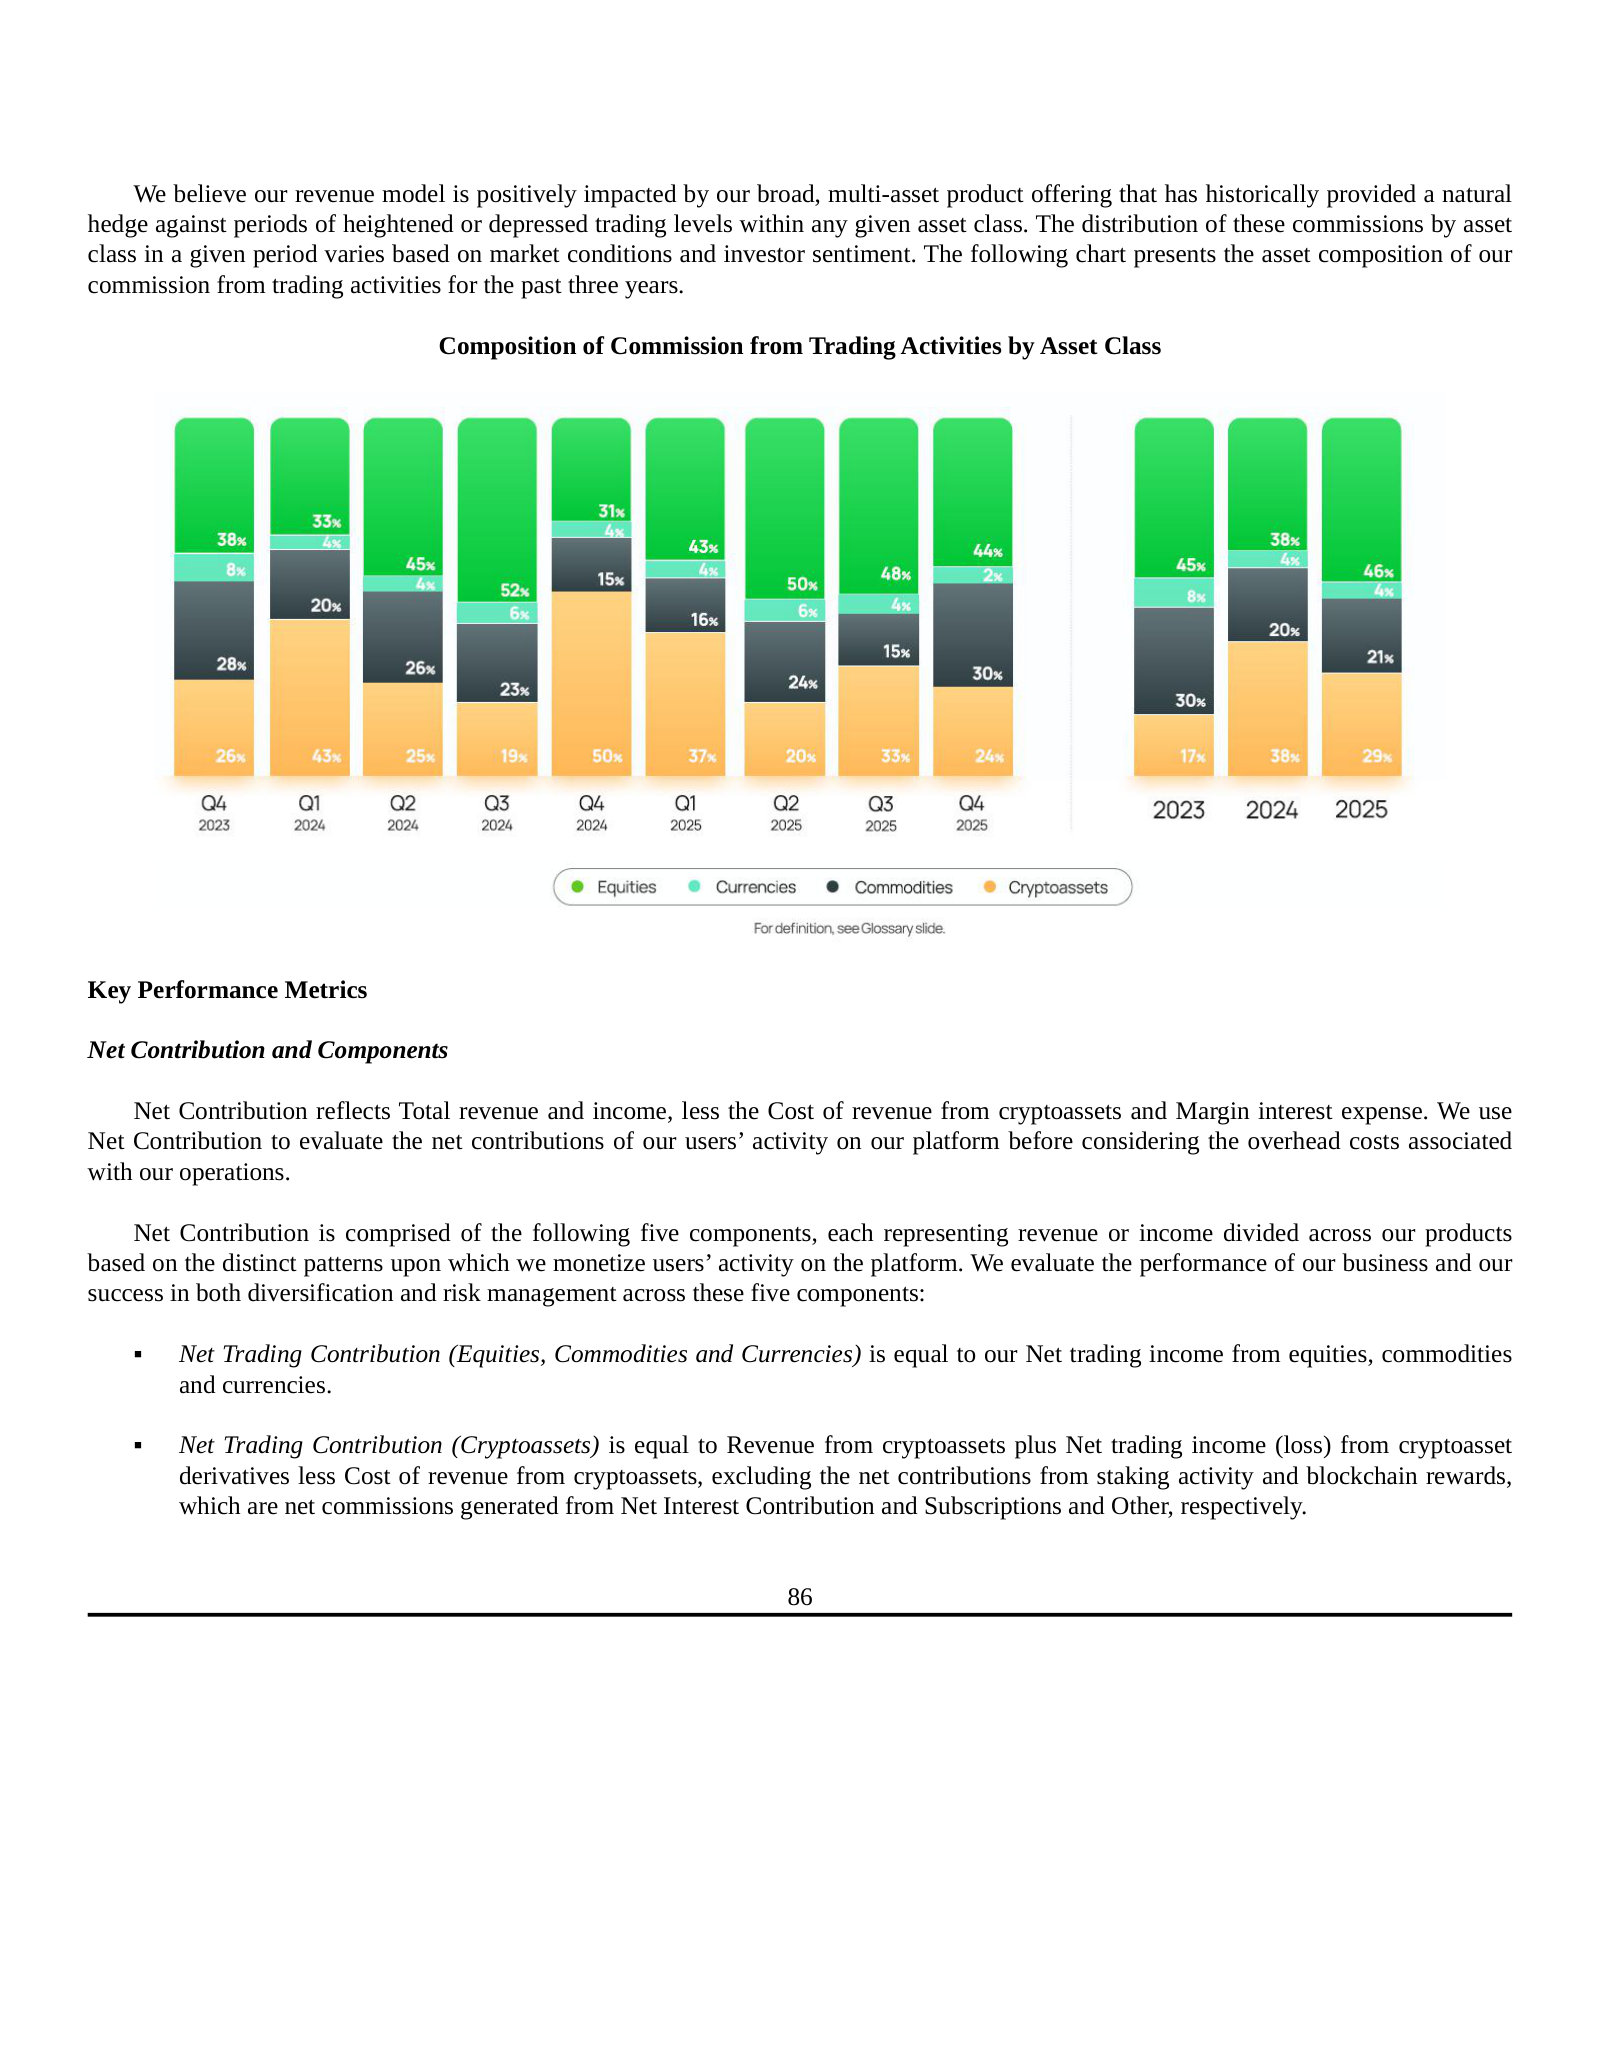
Item 5. Operating and Financial Review — Key Performance Metrics: Net Contribution — p. 128 · Read the full section →
The metric management runs the business on — it strips out the gross crypto revenue and cost that dominate the reported income statement.
Net Contribution = total revenue less cost of crypto revenue and margin interest expense.
Net Contribution reflects Total revenue and income, less the Cost of revenue from cryptoassets and Margin interest expense. We use Net Contribution to evaluate the net contributions of our users’ activity on our platform before considering the overhead costs associated with our operations.
p. 128 · Read in context →
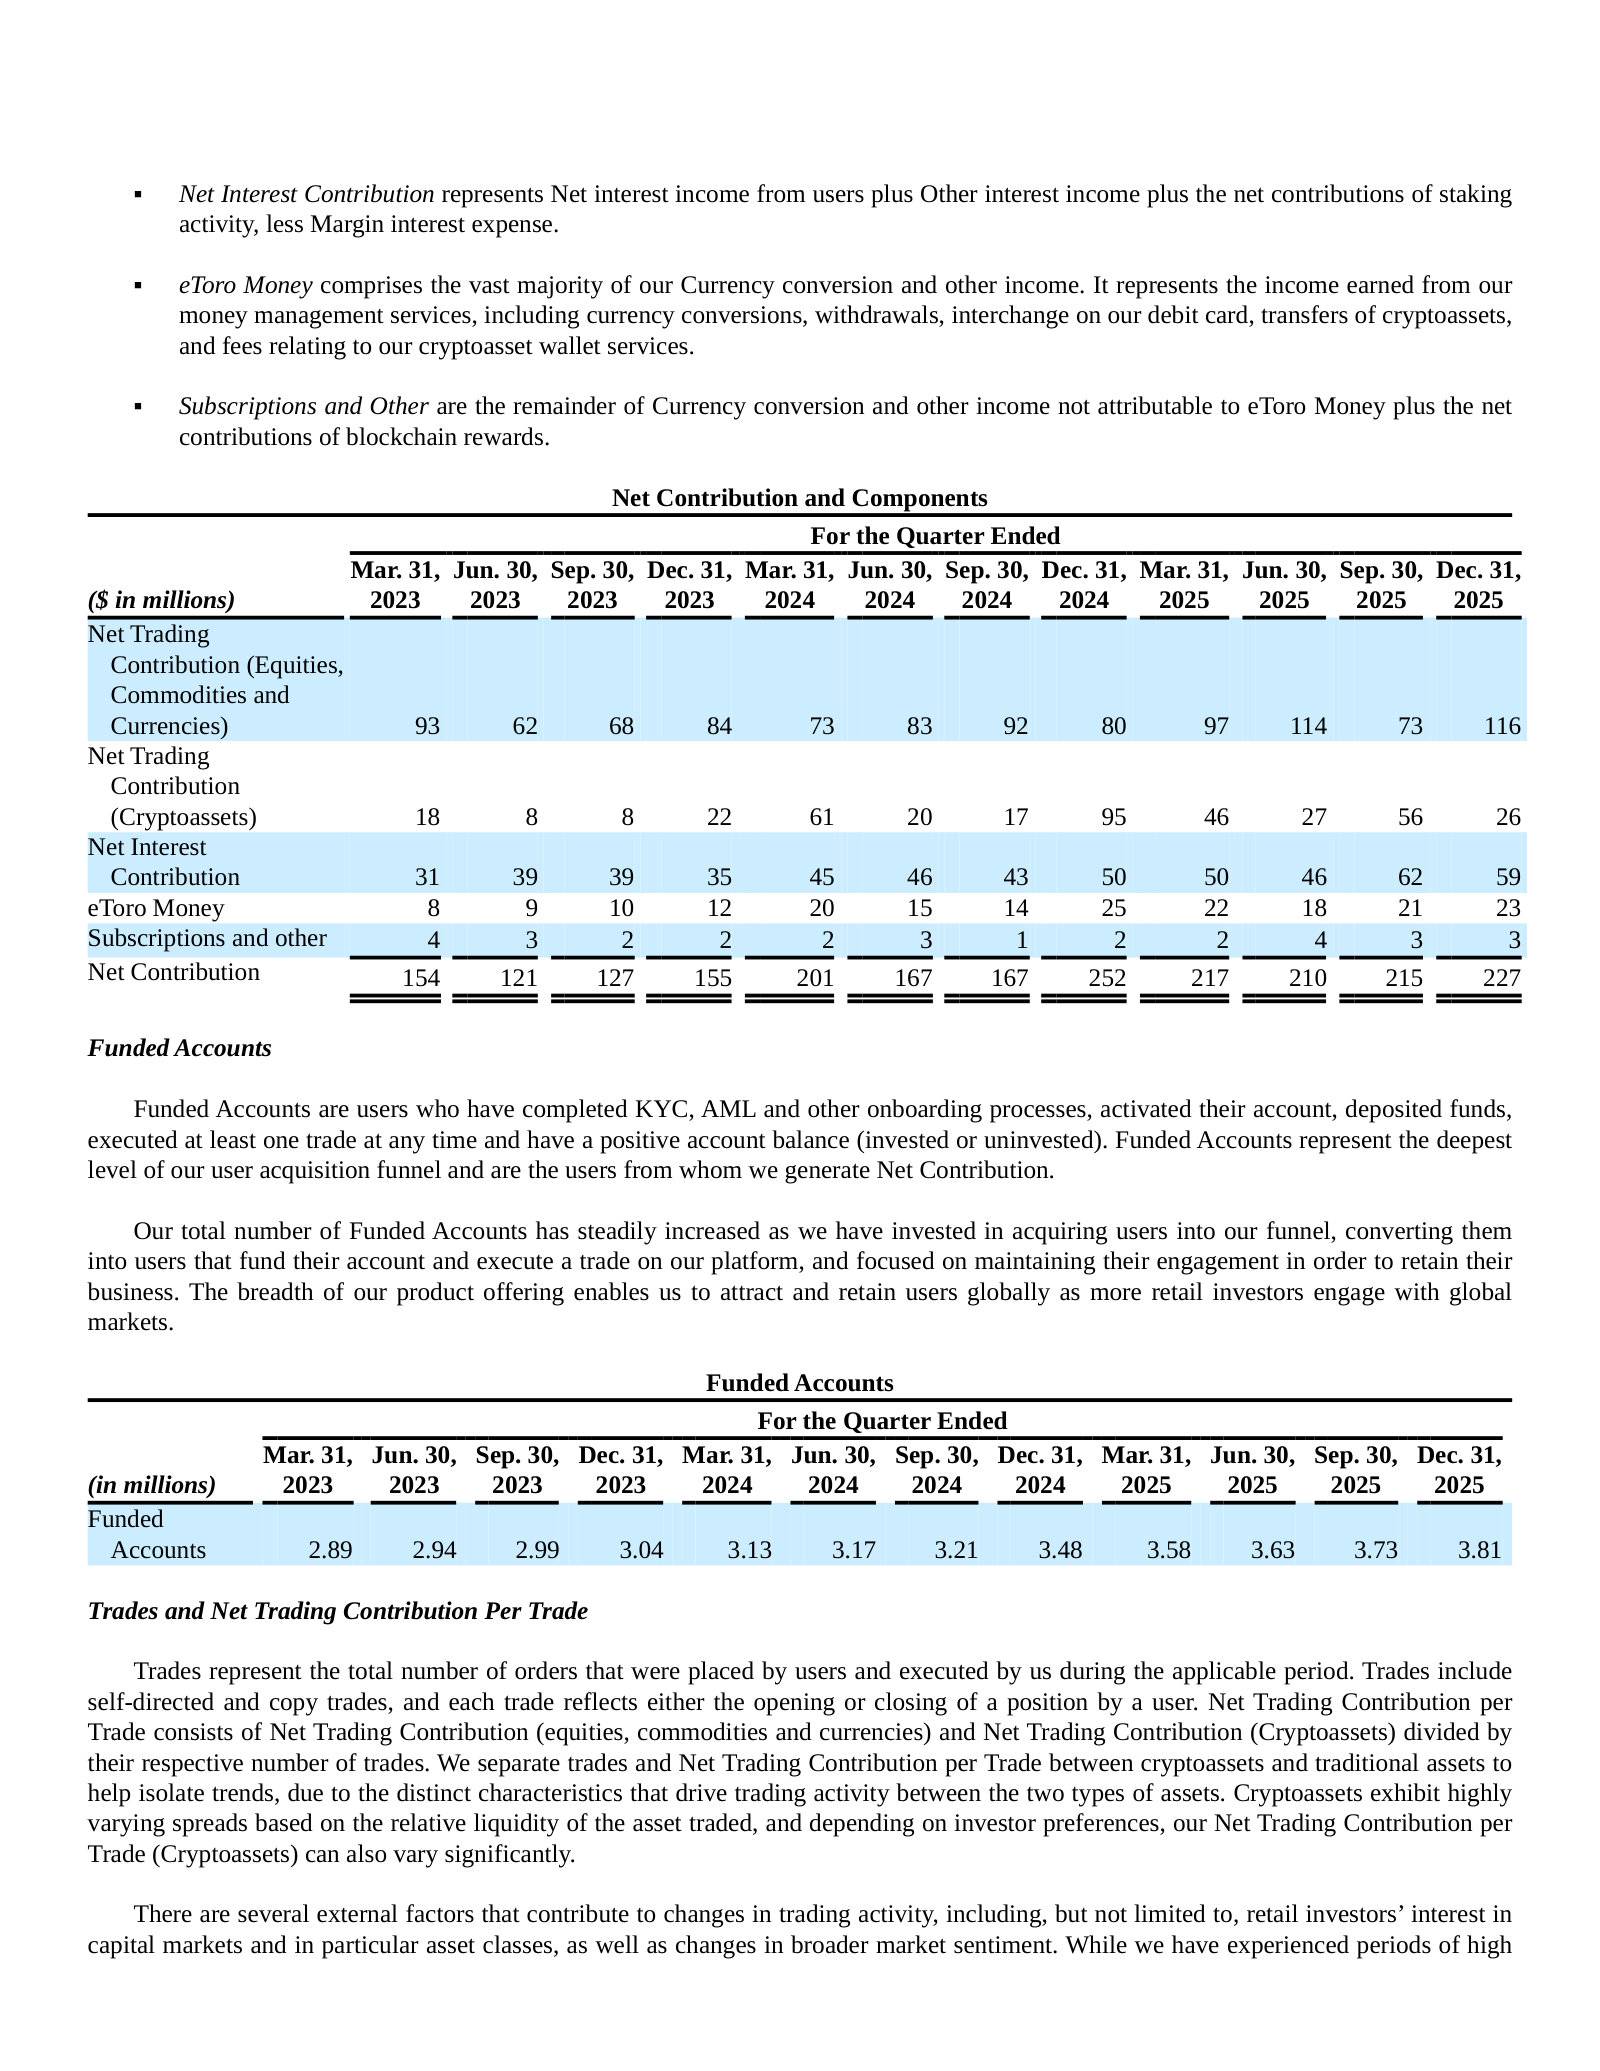
Item 5. Operating and Financial Review — Operating Results — p. 136 · Read the full section →
The income statement's puzzle: $13.0bn crypto revenue against $12.9bn crypto cost, leaving $868m Net Contribution and $216m net income.
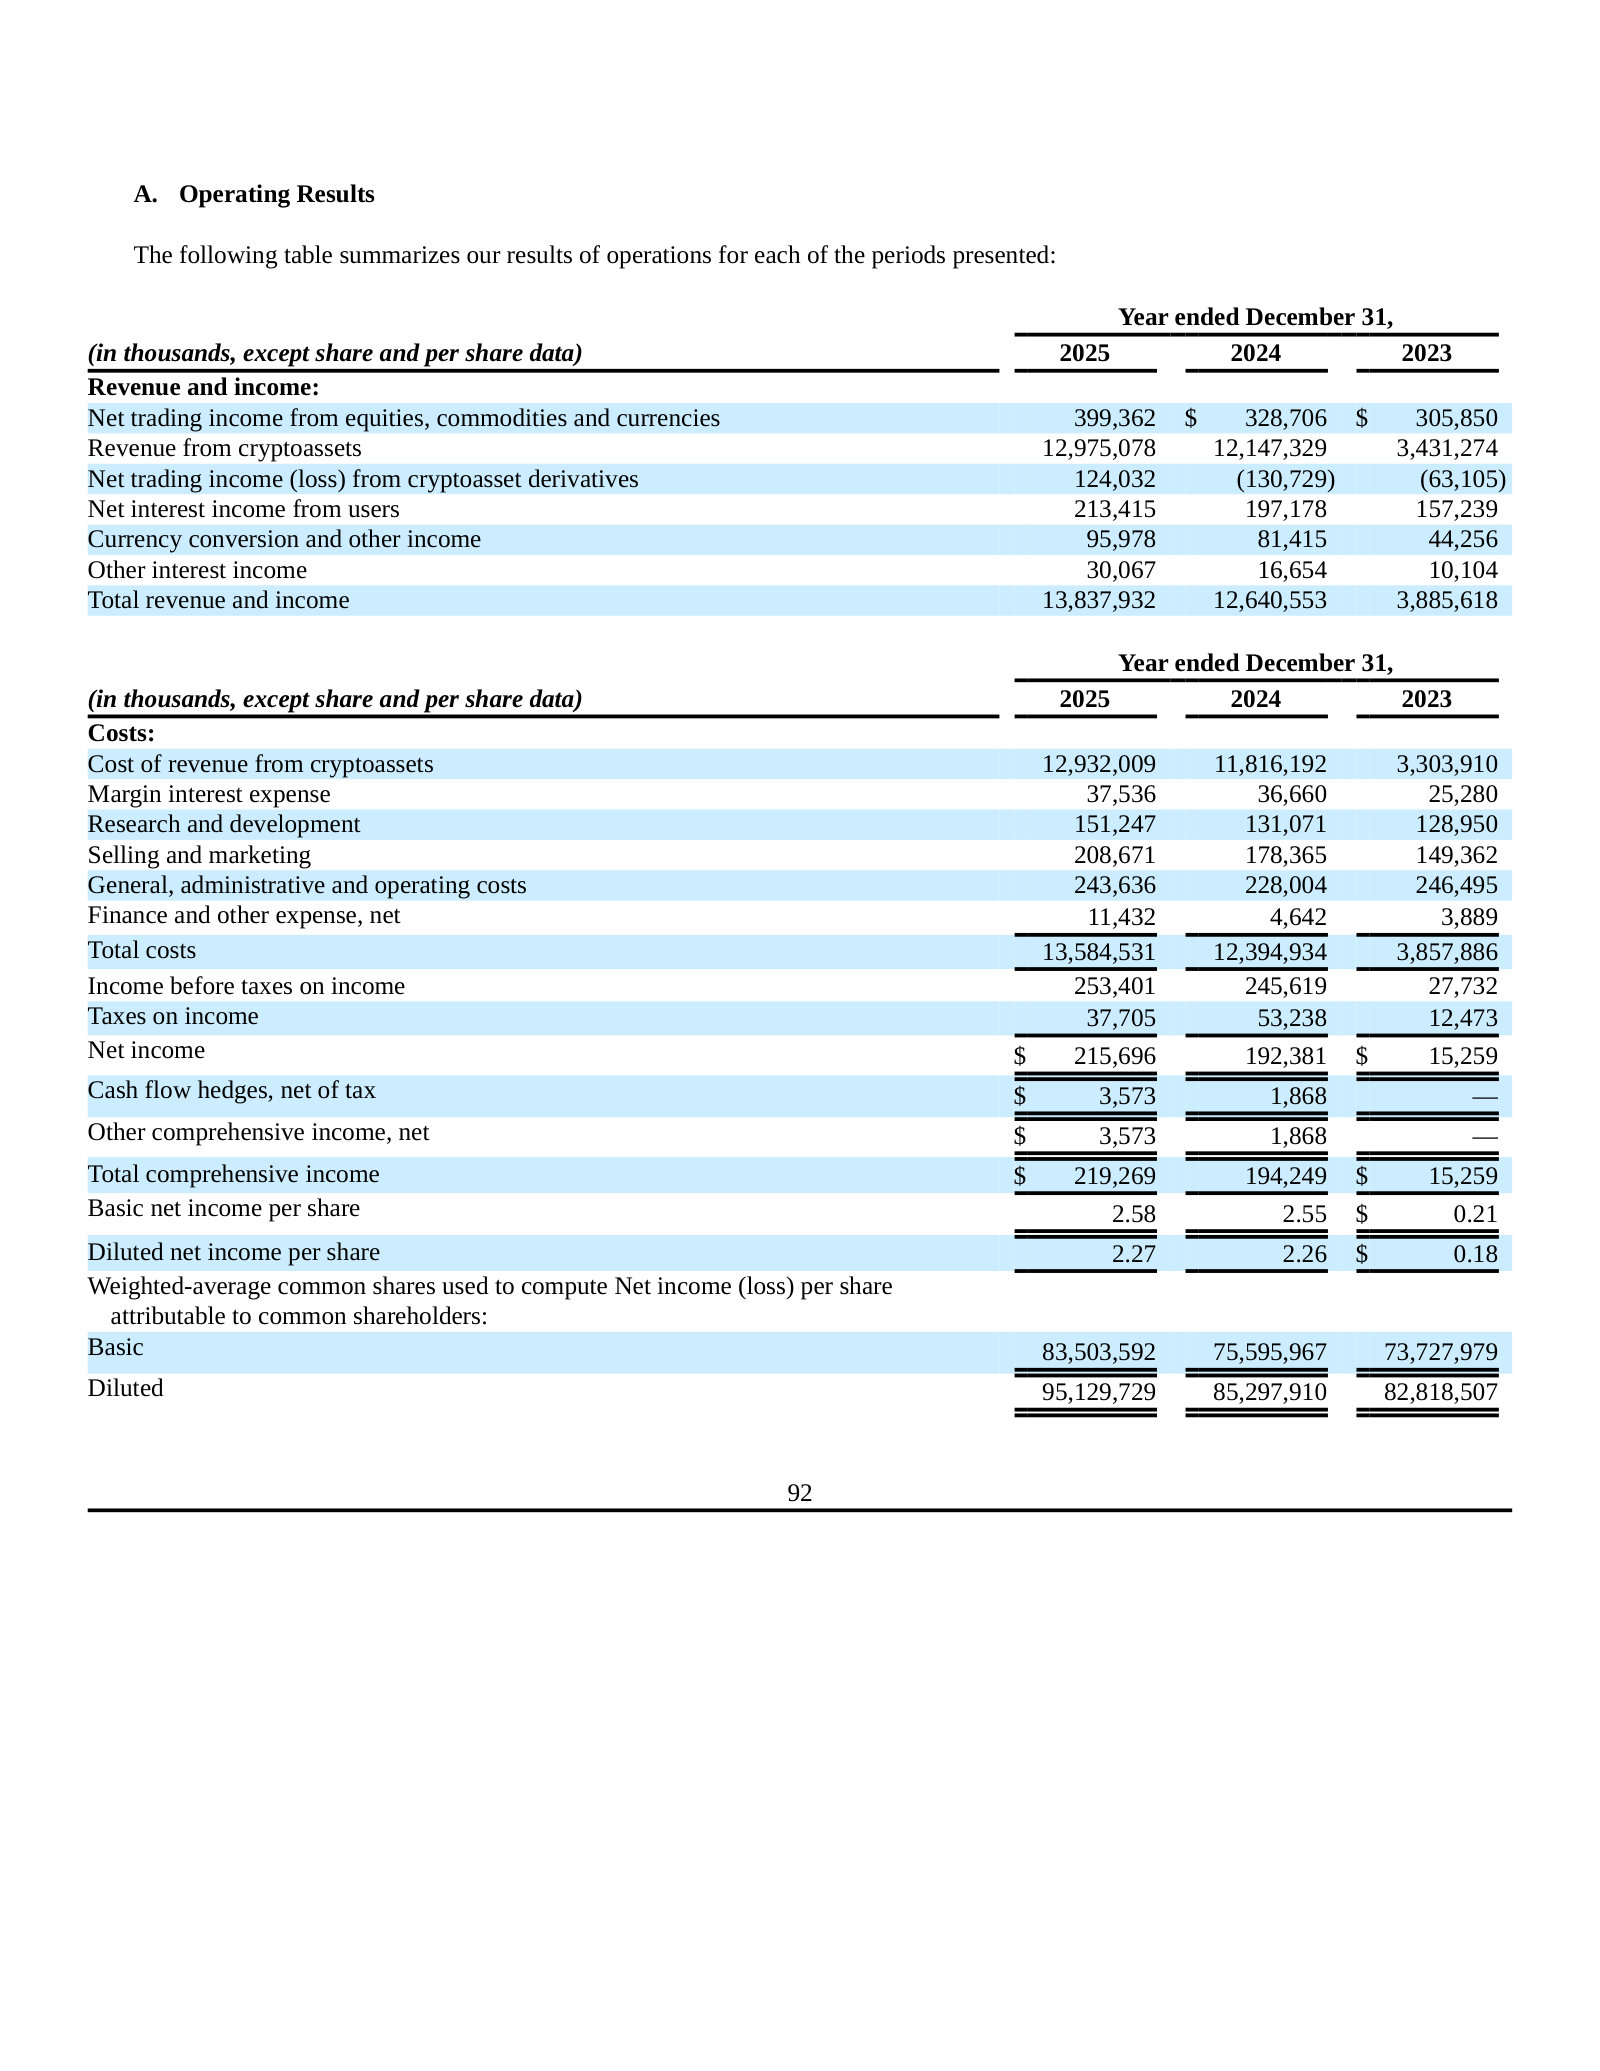
Crypto revenue is booked gross on the sale of cryptoassets to users and counterparties.
When a user trades a cryptoasset as the underlying asset we purchase or sell the underlying asset. When users trade cryptoasset derivatives, we economically hedge our exposure by purchasing or selling the underlying asset. Trading cryptoassets as the underlying asset represents nearly all of our users cryptoasset trading activity. […] We generate Revenue from cryptoassets, which substantially includes revenue generated from the sale of cryptoassets to users and counterparties, and to a lesser extent, revenue generated from staking rewards and blockchain rewards.
p. 137 · Read in context →
Report of Independent Registered Public Accounting Firm — Critical Audit Matter: Cryptoassets — p. 201 · Read the full section →
Defines the custodial model: $4.3bn of users' cryptoassets held off balance sheet, secured by private keys whose loss is the audit risk.
$4,304m of users' cryptoassets held in custody off balance sheet; private-key loss is the critical audit matter.
As more fully described in Note 2 to the consolidated financial statements, as of December 31, 2025, the Company had $62.6 million of cryptoassets presented as current assets, and as described in notes 13 and 18, $4,304 million cryptoassets held on behalf of its users in custody presented off-balance sheet. Cryptoassets are generally accessible only by the possessor of the unique private key relating to the digital wallet in which the cryptoassets are held. Accordingly, private keys must be safeguarded and secured in order to prevent an unauthorized party from accessing them within a digital wallet. The Company holds cryptoassets for its own use, and on behalf of users, in digital wallets and controls the private keys associated with them. The loss, theft, or otherwise compromise of access to the private keys required to access the cryptoassets could adversely affect the Company’s ability to access the cryptoassets within its environment. This could result in loss of cryptoassets.
p. 201 · Read in context →
Competitors describe eToro Group Ltd.'s market in their own filings and calls. These verified passages and visual pages show where their strategies meet, using source documents preserved in Sources.
Robinhood Markets (HOOD)
The closest structural analog to eToro: a mobile-first retail app bundling commission-free stocks, options and crypto for a young, self-directed audience, now pushing hard into eToro's home turf — the UK/EU, tokenized equities and a 'verified trades' social layer that mirrors eToro's copy-trading DNA. Featured on its scale and share, its EU/tokenization strategy and Robinhood Social; the US credit card, banking and prediction-market lines are out of scope except as evidence of the super-app wallet-share push.
Robinhood's own full-year 2025 scorecard and share claim: platform assets up ~70% to $324bn, a record $68bn of net deposits, and $4.5bn of revenue, with management asserting double-digit share gains across equities, options, crypto and margin plus eight straight quarters of net inflows from rival brokers. These are Robinhood's reported figures and its own characterization of share, not an independent measurement — but they set the scale yardstick eToro's funded-account and trading metrics are judged against.
Vladimir Tenev, Chairman & CEO — prepared remarks: Strong double-digit year-over-year market share gains across equities, options, crypto, and margin. By the way, this includes positive net transfers and positive inflows from all of our major brokerage competitors for the last eight quarters in a row, which is pretty amazing. […] Total platform assets grew nearly 70% year over year to 324 billion. Net deposits, a record 68 billion, which is a 35% growth rate. Gold subscribers grew nearly 60% year over year to 4.2 million. Revenues, putting it all together, which were less than 3 billion a year ago, grew to 4.5 billion in 2025.
p. 2 · Read in context →
Robinhood building the feature that is eToro's signature: a social layer with verified profiles, returns and trades, pitched on the premise that users have 'real positions and real returns' — the same transparency-of-track-record hook underneath eToro's Popular Investor / copy-trading network. Rolled out to a first 10,000 customers here, so it is early, but it is a direct move onto eToro's differentiator.
Vladimir Tenev, Chairman & CEO — prepared remarks: Robinhood Social, strong engagement. We've rolled out Robinhood Social to the first 10,000 customers. What we're hearing is they absolutely love verified profiles. They love verified returns and trades. The value proposition for Robinhood Social, as opposed to other social media platforms or places to chat about finances, is you have a guarantee that customers have actual skin in the game with real positions and real returns.
p. 2 · Read in context →
Robinhood's stated European playbook, framed on the call as a 'test case' for a brokerage built entirely on crypto rails: no traditional stocks in the EU, only stock tokens, with management predicting tokenized offerings will beat traditional ones by year-end and its ~750,000 international customers scaling 'into the millions.' This is the same UK/EU retail market where eToro is a scaled incumbent, attacked with a tokenized-equity model.
Vladimir Tenev, CEO — Q&A on international expansion: We are pushing hard on tokenization. By the end of this year, you'll see that tokenized offerings will be better than the traditional offerings. We are going to continue to close the gap with other offerings in the EU as well. We have three-quarters of a million international customers; I think you'll see that getting into the millions relatively quickly.
p. 8 · Read in context →
Coinbase Global (COIN)
Crypto is eToro's single largest revenue driver, and Coinbase is the scaled crypto platform now expanding the other way — into stocks, tokenized equities and prediction markets under its 'Everything Exchange' vision, i.e. eToro's exact multi-asset retail collision, approached from the crypto side. It is also the only peer in this set that names eToro. Featured on that pivot, its crypto scale/share and the eToro relationship; the stablecoin/USDC, Base chain and institutional lines are context, not the focus.
Coinbase's stated pivot from a spot-crypto exchange into a multi-asset trading app — stock trading, 24/7 equity perps, derivatives and prediction markets — the 'Everything Exchange' strategy that converges on eToro's stocks-plus-crypto model. The $200m derivatives and $100m prediction-market annualized revenue run-rates are Coinbase's own early figures for nascent lines, offered as validation of the strategy.
Brian Armstrong, Co-Founder & CEO — prepared remarks: We heard from customers that they wanted to trade more than just crypto on Coinbase, and I'm excited to share that in the past year, we've transformed Coinbase from a primarily spot-focused crypto platform into a place where you can now trade any asset class. We've added stock trading, 24/7 equity perps, retail access and geographic expansion for derivatives, we've added prediction markets. And we're starting to see real traction now validating our Everything Exchange strategy. Derivatives trading is now over $200 million in annualized revenue. Prediction markets are scaling fast, reaching $100 million in annualized revenue in March. That's just 2 months after launch.
p. 2 · Read in context →
Coinbase's own sizing of its crypto position — a claimed 12% of all crypto globally, 'more than our next four competitors combined,' and doubled trading volume/share — alongside the plan to add ~10,000 equity tickers, offer tokenized equities and take the Everything Exchange international. The share figures are Coinbase's self-assessment; the equities and geographic-expansion moves are the direct threat to eToro's multi-asset retail franchise.
Brian Armstrong, Co-Founder & CEO — prepared remarks: We hold 12% of all crypto globally, more than our next four competitors combined. Our platform's assets have nearly tripled in the last three years, and they tend to remain with us as we enhance our offerings. Second, we've doubled our trading volume and market share annually. We began as the market leader in the U.S. and are now expanding our international presence as regulatory clarity improves worldwide. […] We are also rolling out nearly 10,000 equity tickers this month and have acquired Echo to facilitate efficient on-chain capital formation, paving the way for unique investment opportunities. We’re working towards offering tokenized equities, which can significantly enhance the financial system. With the supportive leadership of the SEC towards crypto, we see a clear pathway forward. We will also broaden the Everything Exchange to additional countries.
p. 1 · Read in context →
The one place a peer names eToro — and it is as a customer, not just a rival. Coinbase lists eToro among ~240 institutions using its Crypto-as-a-Service infrastructure (alongside JPMorgan, Revolut and Webull), a 'frenemy' dynamic in which a direct retail competitor also leans on Coinbase's crypto rails. Coinbase's framing; it does not disclose the scope of the eToro relationship.
Brian Armstrong, Co-Founder & CEO — Q&A: Many companies are entering the crypto space and they often do not want to build the necessary infrastructure themselves. Storing private keys securely and integrating with various blockchains is complex, as is executing trades and onchain payments. Therefore, many are turning to Coinbase. We have a long history in this area and previously decided to offer the services we developed for our own needs to third parties, similar to what Amazon did with AWS. We refer to this as Crypto-as-a-Service or CaaS. […] Currently, around 240 institutions are using these Coinbase solutions in different ways. We recently announced a partnership with PNC, which has been going well, and we are also working with several others like JPMorgan, eToro, Revolut, and Webull, with more partnerships in the works.
p. 4 · Read in context →
Plus500 (PLUS)
A direct retail multi-asset competitor with the same DNA as eToro — an Israel-founded, proprietary-platform trading business whose core is retail CFDs across shares, indices, FX, commodities and crypto, now diversifying into share dealing ('Plus500 Invest') and US futures across the UK, EEA and international markets eToro also serves. Featured on its product scope, retail customer/ARPU metrics and diversification; the US-futures B2B infrastructure build is context for the diversification, not the focus.
Plus500's CEO sizes the group and its diversification: 30m+ registered customers across 60+ countries, and a non-OTC (share dealing and futures) business now ~10% of revenue, ~15% of new customers and ~36% of customer deposits. The registered-customer count is a cumulative sign-up figure, not active users; the exhibit shows Plus500 moving beyond CFDs toward the multi-asset mix eToro runs.
David Zruia, Chief Executive Officer — CEO review: In recent years, as guided by its strategic roadmap, Plus500 has expanded and diversified its global operations to become a provider of market infrastructure services and proprietary trading platforms in the US futures market, as well as trading platforms across OTC markets and share dealing. Today, the Group offers a wide variety of products and services across its OTC, share dealing and futures offerings. It operates in more than 60 countries and has over 30 million customers registered on its platforms globally. […] In FY 2024, the non-OTC business as a whole contributed approximately 10% of total Group revenue and approximately 15% of New Customers, which highlights the growing importance of these businesses to the continued success and future growth of the Group. Non-OTC customer deposits in FY 2024 were $1.1bn, representing approximately 36% of total customer deposits on a Group level.
p. 9 · Read in context →
Plus500's reported retail funnel for FY2024: 118,010 new customers (+30%), 254,138 active customers (+9%), average deposit per active customer of ~$12,000, $3.0bn of total customer deposits and annualized ARPU of $3,023. These are the funded-account and monetization metrics most directly comparable with eToro's own — a smaller active base than eToro's but a high-value, CFD-led one.
The Group onboarded a total of 118,010 New Customers during the year (FY 2023: 90,944), equating to an increase of 30% year-on-year, reflecting its investment in its multi-channel approach to customer acquisition. This improved performance also reflects the expansion of the Group’s businesses in the US futures market and wider strategic investments in its technological marketing capabilities.
Customer deposits grew once again during the year, with the Average Deposit per Active Customer reaching approximately $12,000 (FY 2023: approximately $10,300), highlighting the level of confidence that customers have in Plus500 and the Group’s ongoing focus on higher value customers. Total customer deposits in FY 2024 increased to $3.0bn (FY 2023: $2.4bn), which are both record levels for Plus500. […] The number of Active Customers during FY 2024 increased by 9% to 254,138 (FY 2023: 233,037), thanks to the Group’s customer retention, monetisation and activation technologies.
ARPU reached an annualised level of $3,023 in FY 2024 (FY 2023: $3,116), which highlighted the depth of the Group’s product offering, the high-quality nature of its trading platforms
p. 40 · Read in context →
The audited self-definition of the product overlap: Plus500 as a 'global multi-asset fintech group' spanning CFDs, share dealing and futures, with trading income arising on client positions 'primarily in OTCs on shares, indices, ETFs, options, commodities, cryptocurrencies and foreign exchange' — essentially eToro's asset menu, offered largely as leveraged CFDs.
Plus500 Ltd. (the “Company” and together with its subsidiaries, the “Group”) is a global multi-asset fintech group operating proprietary technology-based trading platforms. Plus500 offers customers a range of trading products, including OTC (“Over-the-Counter” products, namely Contracts for Difference (“CFDs”)), share dealing, as well as futures and options on futures. […] Trading income represents Customer Income, which includes revenue from OTC Customer Income (customer spreads and overnight charges), non-OTC Customer Income (commissions from the Group’s futures and options on futures operation and from the Group’s share dealing platform) and Customer Trading Performance, which includes gains/losses on customers’ trading positions, arising on client trading activity, primarily in OTCs on shares, indices, ETFs, options, commodities, cryptocurrencies and foreign exchange.
p. 115 · Read in context →
IG Group Holdings (IGG)
The self-described largest retail OTC/CFD provider worldwide — the leveraged-trading category that is eToro's largest business — now diversifying straight into eToro's other lines: commission-free share dealing (IG Invest and the Freetrade acquisition, aimed at 20–30-somethings) and cash crypto. Featured on its market leadership and economics, and on the equities/crypto diversification; the US tastytrade options franchise is adjacent and noted in more_documents.
IG's claim to be the largest retail OTC/CFD provider worldwide, with 19,000+ instruments, and its framing of the OTC model — revenue from spread, commission and funding charges, 'not driven by client losses.' The leadership claim is IG's own; the economics statement is the industry's live debate over CFD business models, the same one that shapes how eToro's leveraged-trading revenue is scrutinized.
IG pioneered the retail over-the-counter (OTC) derivatives category, and we are the largest provider of these products to retail traders worldwide. Our platform provides access to over 19,000 underlying instruments globally. […] Our revenue is driven by spread, commission and overnight funding charges, it is not driven by client losses. We want our customers to trade successfully and we invest in content, education and tools to help them do so.
p. 8 · Read in context →
IG's push into eToro's non-CFD lines: the Freetrade acquisition (AUA +38%, a young 20s–30s customer base that 'broadens our addressable market') gives it a commission-free share-dealing brand, and its UK cash-crypto launch with Uphold — the first by a UK-listed company — adds spot crypto. Two of eToro's core propositions, entered by IG in a single year.
Breon Corcoran, Chief Executive Officer — CEO statement: Freetrade delivered strong growth in FY25, in line with expectations, with assets under administration up 38% and total revenue increasing 22%. It brings us capabilities I have talked a lot about, including a strong brand, differentiated user experience, rapid product velocity, highly scalable technology and a proven ability to acquire and serve customers at low cost.
With most of Freetrade’s customers in their 20s and 30s, the acquisition broadens our addressable market and provides us with optionality around new product and market entry. […] We achieved a significant milestone in May 2025 when we launched our UK cash crypto offering in partnership with Uphold, becoming the first UK-listed company to provide the product to retail customers and we are now live with 35 coins.
p. 17 · Read in context →
IG sizing the shared UK crypto opportunity: combined OTC and spot-crypto revenue growing 30–40% year on year and a self-estimated ~5% share of UK direct-to-consumer crypto trading revenue. The share figure is IG management's own estimate, offered to argue its earnings are diversifying beyond CFDs — the same crypto-plus-trading retail pool eToro competes in.
Clifford Abrahams, Chief Financial Officer — FY2025 results call: In the UK, our combined OTC and spot crypto revenue is growing 30% to 40% year on year, and we estimate around 5% share of UK direct-to-consumer crypto trading revenue.
p. 4 · Read in context →
CMC Markets (CMCX)
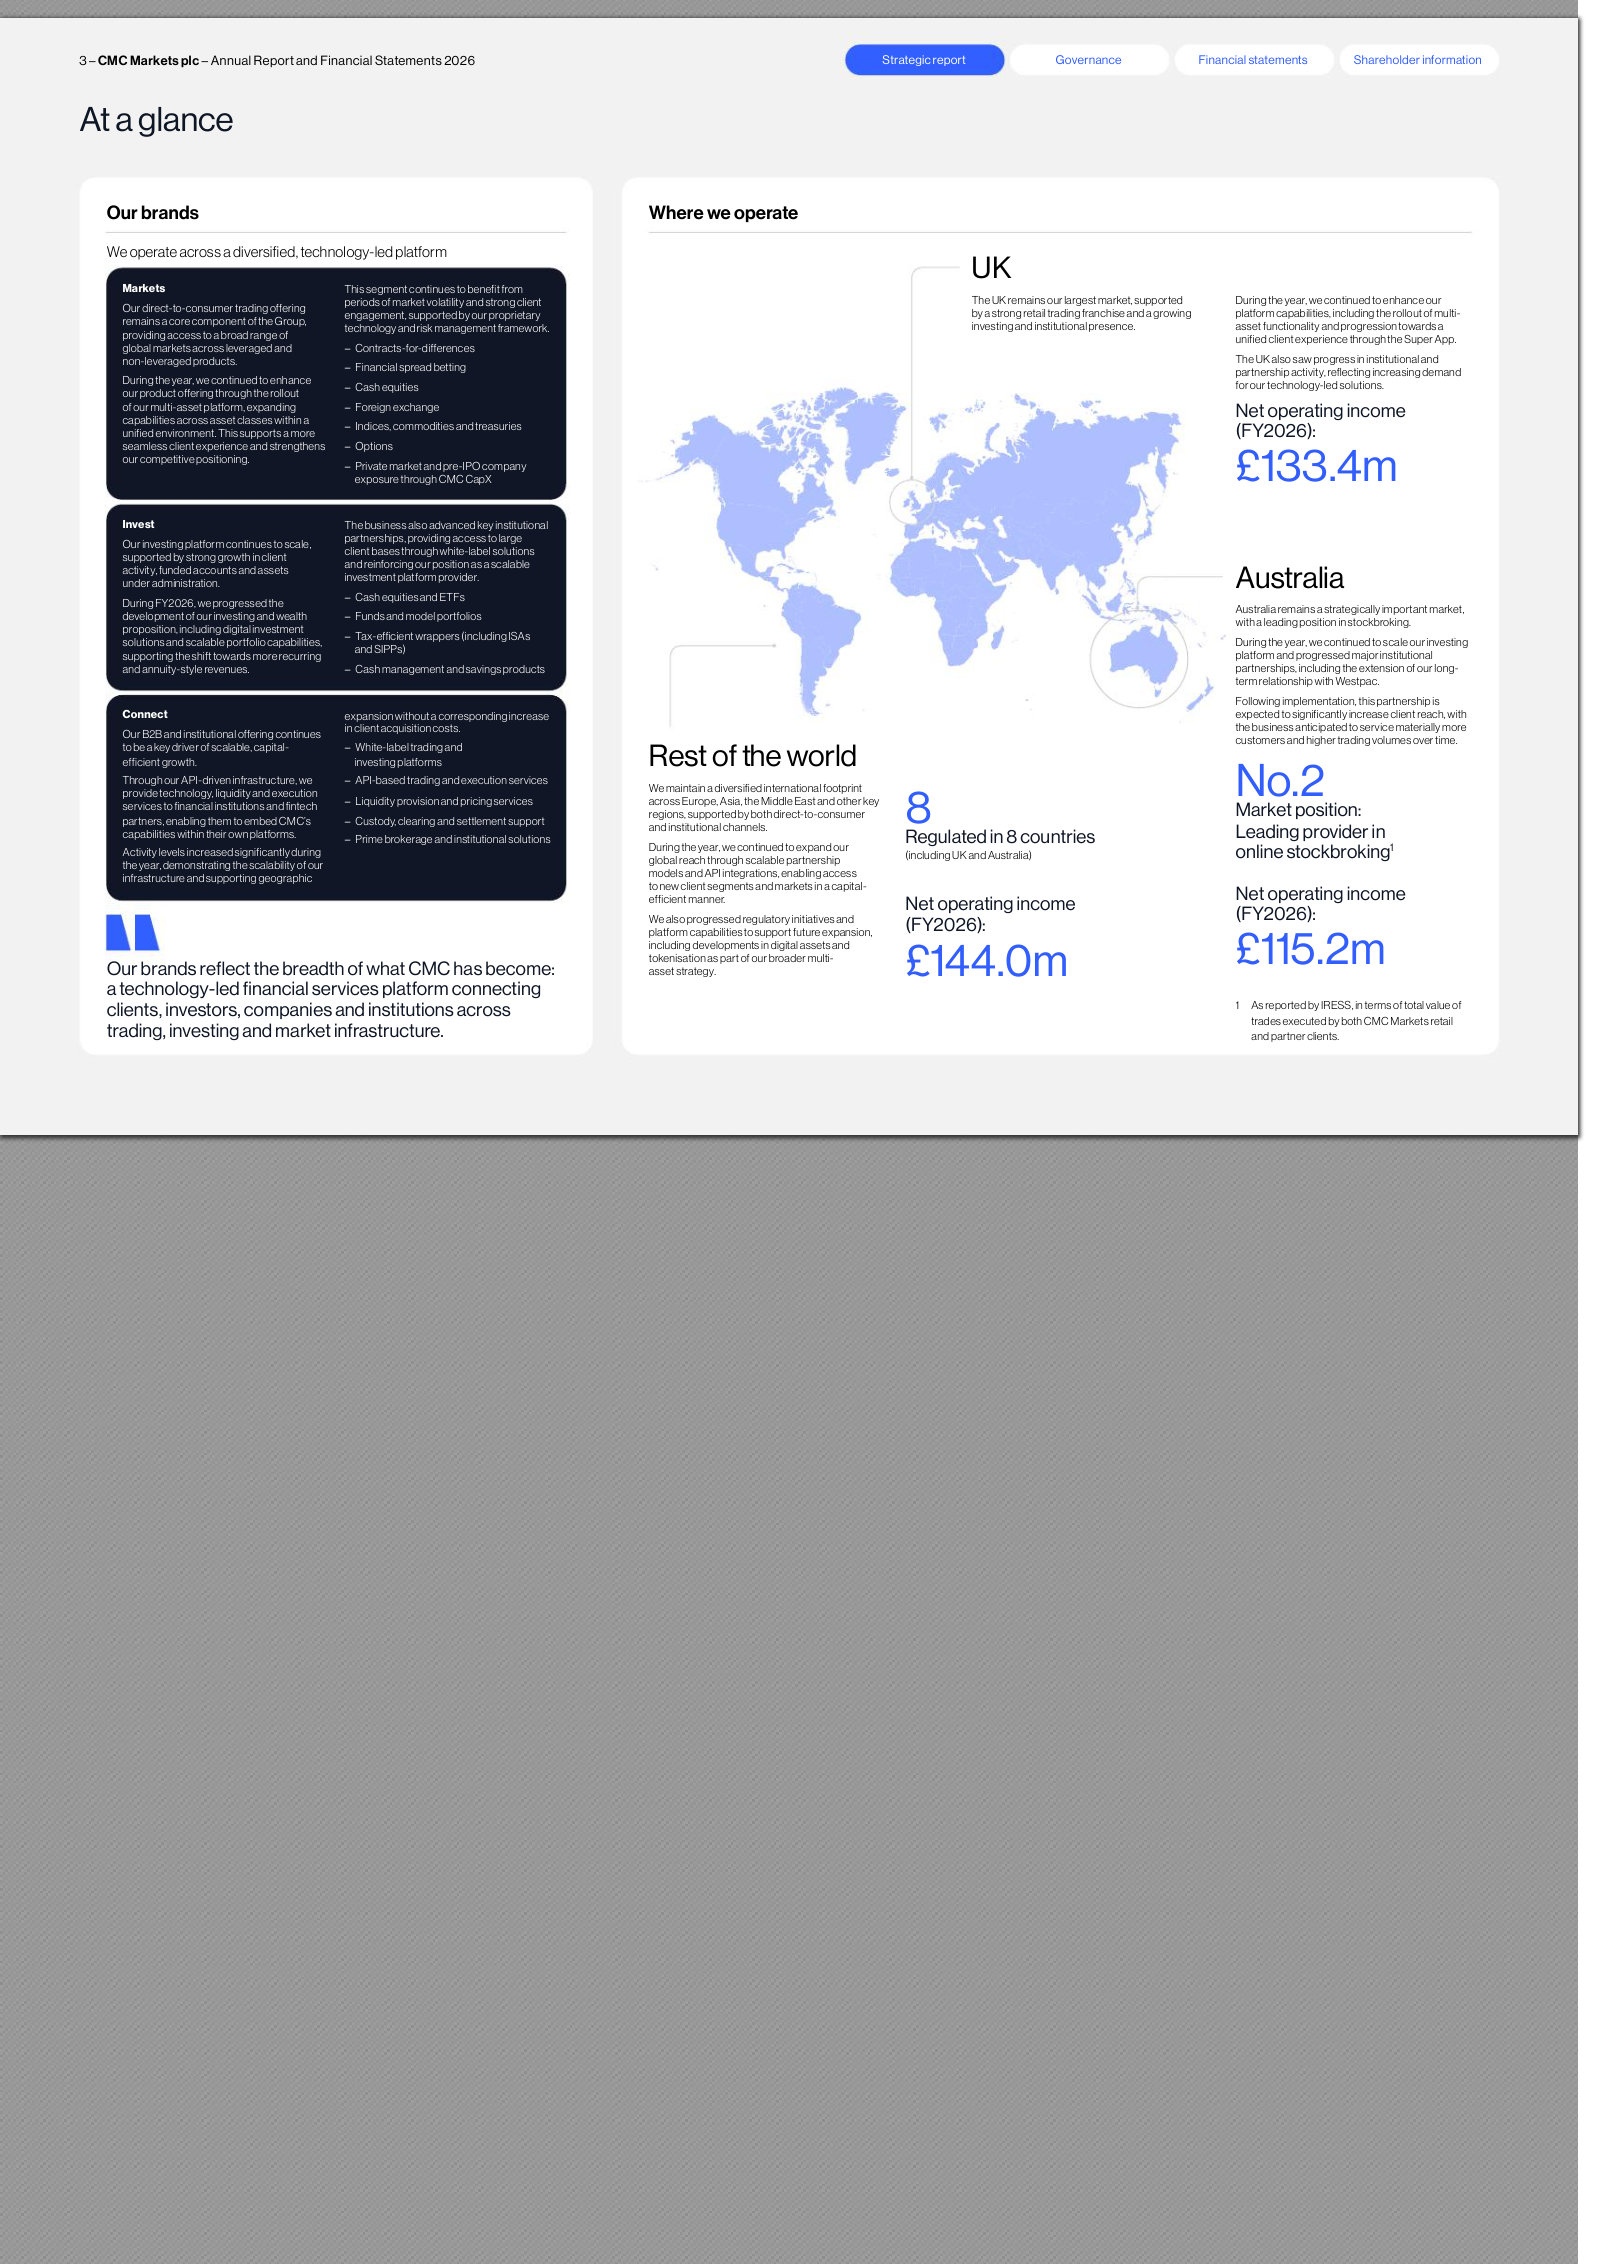
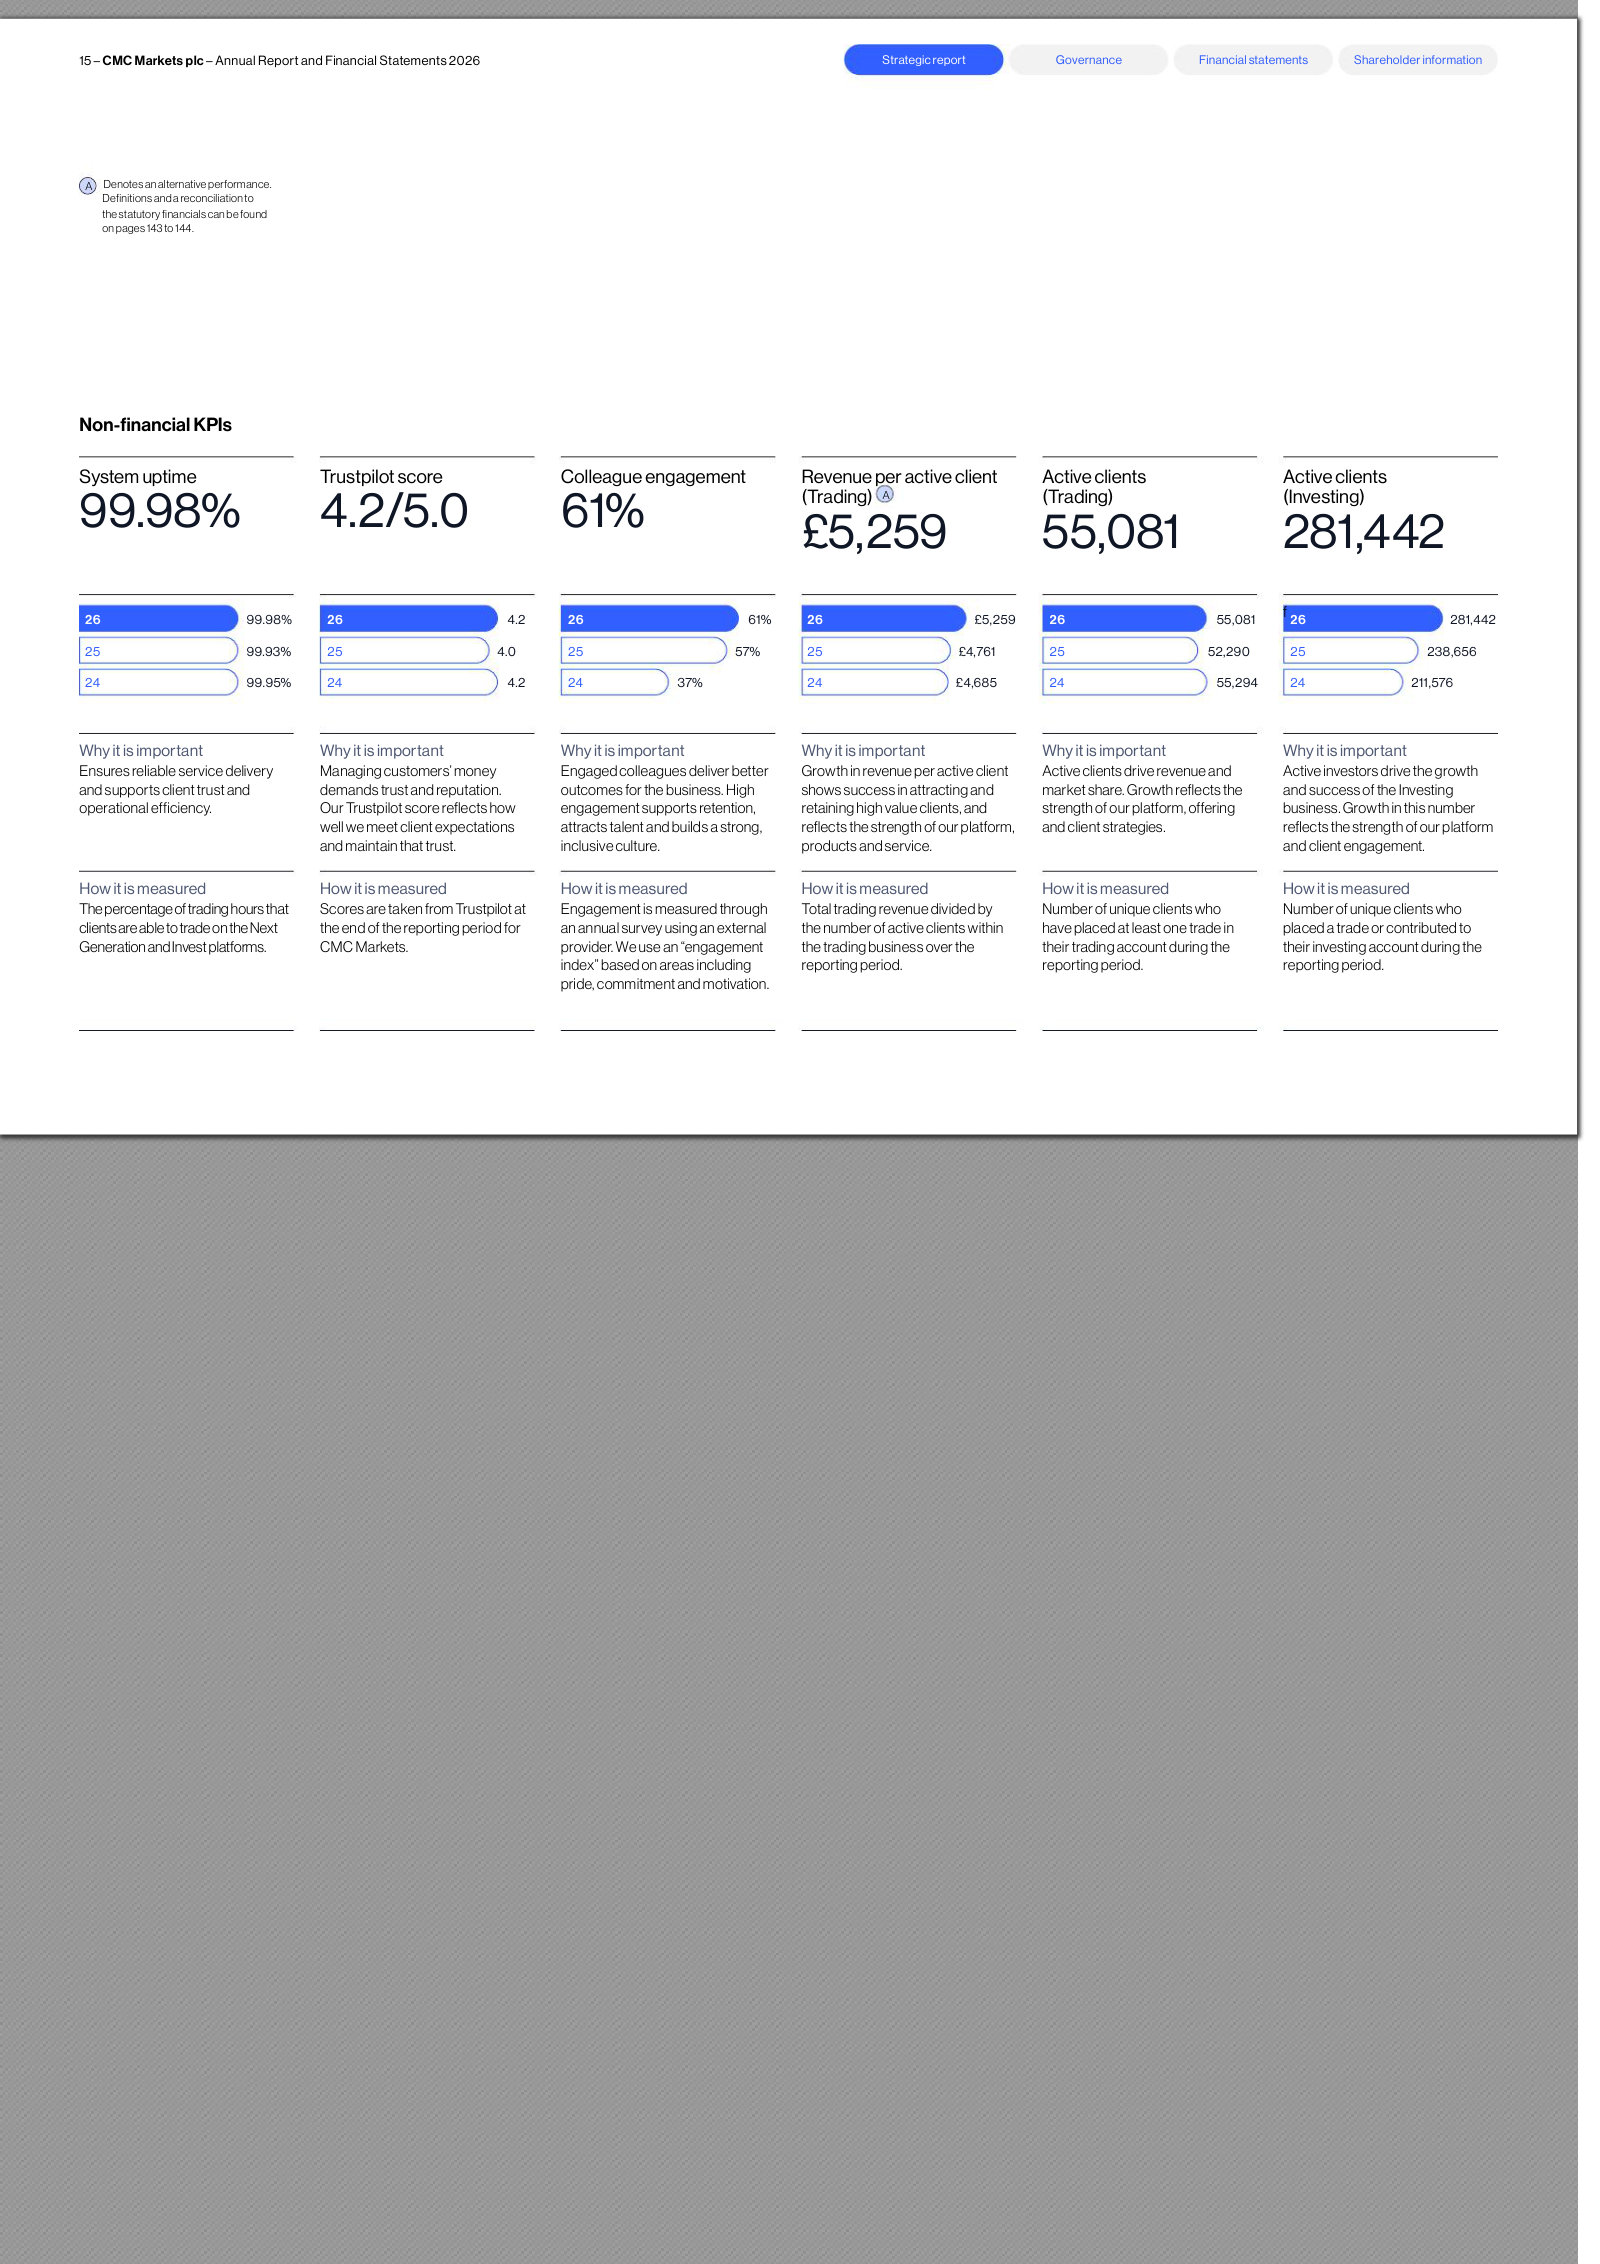
A direct multi-asset direct-to-consumer competitor: a UK/Australia-listed leveraged-trading firm (CFDs and spread betting) that, like eToro, has layered on a non-leveraged investing platform (equities, ETFs, ISAs/SIPPs) and is building a multi-asset 'Super App' — while also running a B2B/institutional infrastructure arm eToro largely lacks. Its annual report parsed with heavy OCR damage, so both exhibits are page images of the actual pages. Featured on its product/segment breadth and its trading-vs-investing client economics.
Interactive Brokers Group (IBKR)
The global multi-asset electronic broker for individual and professional investors across 200+ countries — the low-cost, worldwide-access benchmark eToro's international retail franchise is measured against, and increasingly a direct rival as IBKR rolls out retail crypto across Europe, prediction/event contracts and localized retail products. Featured on its multi-asset reach/scale and those retail-facing moves; its institutional and market-making businesses sit outside the eToro overlap.
Interactive Brokers' own sizing of its multi-asset, global platform: every major tradable class — including cryptocurrencies and forecast contracts — across 170+ venues in 40 countries and 29 currencies, serving ~4.4 million customers. This breadth-and-reach is the benchmark eToro's 'invest globally from one app' proposition is compared with, at the lower-cost, more sophisticated end of the retail market.
We offer our customers access to all tradable classes of primarily exchange-listed products, including stocks, options, futures, forex, bonds, mutual funds, ETFs, precious metals, cryptocurrencies, and forecast contracts traded on more than 170 electronic exchanges and market centers in 40 countries and in 29 currencies around the world. […] Since the launching of our electronic brokerage business in 1993, we have grown to approximately 4.4 million institutional and individual brokerage customers. We provide our customers with what we believe to be one of the most effective and efficient automated brokerage platforms in the industry.
p. 9 · Read in context →
IBKR's recent account momentum and its move onto eToro's turf: 34% new-account growth, a record $182bn of uninvested client cash and $930bn of client equity, plus retail-facing launches — the SpaceX IPO offered to UK and European retail clients and crypto rolled out across Europe (live in the UK since 2024). The metrics are IBKR's reported results; the European retail crypto/IPO access is the direct collision with eToro.
Nancy Stuebe, Director of IR (presenting CEO Milan Galik's remarks) — Q2 2026 call: 34% growth in new accounts drove client uninvested cash balances higher by 27% year-over-year to a record $182 billion. With competitive interest rates and a solid balance sheet, IBKR provides an attractive choice for clients to place their idle cash. Client equity rose 40% to $930 billion. We introduced multiple new products and initiatives this quarter. […] In Europe, we directly offered the SpaceX IPO to eligible U.K. and European retail clients, providing access across multiple countries. We also began offering cryptocurrencies throughout Europe. We have been offering crypto in the U.K. since 2024.
p. 1 · Read in context →
More peer documents
HOOD_annual_report_FY2025 — 221 pages · The 10-K defines Robinhood's competitive set (incumbent brokers, fintechs, crypto exchanges) and discloses 'Robinhood Stock Tokens' launched in the EEA in June 2025 — filing-grade confirmation of tokenized US equities offered to European retail. · Open →
COIN_annual_report_FY2025 — 179 pages · Item 1 states the 'Everything Exchange' mission — 'a single platform to trade any asset, anywhere in the world' — and Coinbase's competition framing against US/European fintechs; the durable, filed version of the multi-asset collision. · Open →
PLUS_annual_report_FY2025 — 30 pages · The Plus500UK subsidiary report gives the retail product scope in one line — CFDs across 2,500+ underlying instruments (equities, ETFs, FX, indices, options, commodities) on a proprietary multi-device platform. · Open →
Q1_FY2026 — 8 pages · IBKR details its retail crypto build — EEA expansion, crypto transfers, access to the Coinbase Derivatives Exchange and 24/7 prediction markets — the fullest account of it moving retail crypto onto eToro's ground. · Open →
Source: S&P Capital IQ consensus via Xpressfeed · Generated 2026-08-01.
eToro's consensus tape is in a margin-led upgrade cycle: FY2027 normalized EPS estimates have climbed roughly 16% over the past six months against about 3% for revenue, and the same divergence repeats in FY2028. Recent prints reinforce it - revenue has topped consensus five quarters running - though normalized EPS surprises remain volatile. The street is constructive (10 of 15 ratings positive, none negative), but coverage thins sharply beyond FY2027.
FY2027 normalized EPS up ~16% over six months while revenue estimates rose only ~3%
The same divergence holds in FY2028 - normalized EPS up ~17% over 180 days versus ~7% on revenue - consistent with rising expected margins rather than faster top-line growth.
Currency: USD · Scale: money in millions, absolute · Point-in-time consensus; Δ90d is Now versus 90d.
| Metric | FY | 180d | 90d | 30d | Now | Δ90d |
|---|---|---|---|---|---|---|
| EPS (normalized) | FY2027 | $2.90 | $3.06 | $3.24 | $3.35 | +9.5% |
| EPS (normalized) | FY2028 | $3.31 | $3.49 | $3.76 | $3.88 | +11.3% |
| Revenue | FY2027 | $1.04bn | $1.05bn | $1.06bn | $1.07bn | +1.9% |
| Revenue | FY2028 | $1.06bn | $1.09bn | $1.11bn | $1.13bn | +3.5% |
Revenue has beaten consensus five quarters straight; normalized EPS swings from -39% to +23%
Current sequences by metric: Revenue: 5 consecutive beats; EPS (normalized): 2 consecutive beats.
Currency: USD · Scale: money in millions, absolute · Consensus is captured before each actual first became effective.
| Quarter | Metric | Consensus | Actual | Surprise | Outcome |
|---|---|---|---|---|---|
| Q1 FY2026 | Revenue | $233.40m | $258.15m | +10.6% | Beat |
| Q1 FY2026 | EPS (normalized) | $0.70 | $0.86 | +22.7% | Beat |
| Q4 FY2025 | Revenue | $217.96m | $226.78m | +4.0% | Beat |
| Q4 FY2025 | EPS (normalized) | $0.60 | $0.69 | +15.4% | Beat |
| Q3 FY2025 | Revenue | $208.35m | $214.60m | +3.0% | Beat |
| Q3 FY2025 | EPS (normalized) | $0.55 | $0.53 | -3.8% | Miss |
| Q2 FY2025 | Revenue | $194.70m | $209.63m | +7.7% | Beat |
| Q2 FY2025 | EPS (normalized) | $0.51 | $0.31 | -39.2% | Miss |
| Q1 FY2025 | Revenue | $213.42m | $217.37m | +1.8% | Beat |
| Q1 FY2025 | EPS (normalized) | $0.63 | $0.69 | +9.1% | Beat |
Revenue growth decelerates toward mid-single digits as EBITDA and EPS compound faster
On consensus means, revenue growth eases from ~12% (FY2026) to ~5% (FY2028) while EBITDA rises from ~$359M to ~$481M; note FY2028 rests on far fewer analysts.
Currency: USD · Scale: money in millions, absolute · YoY uses the prior fiscal year from the feed; analyst count and range use the first displayed period.
| Metric | FY2026E | FY2027E | FY2028E | YoY | Analysts | Low / high |
|---|---|---|---|---|---|---|
| Revenue | $968.17m | $1.07bn | $1.13bn | +11.5% | 11 | $908.66m / $1.02bn |
| EBITDA | $359.25m | $425.96m | $480.51m | +13.3% | 10 | $348.00m / $378.37m |
| EPS (normalized) | $2.84 | $3.35 | $3.88 | +25.3% | 12 | $2.58 / $3.22 |
Where the street disagrees
Currency: USD · Scale: money in millions, absolute · Spread/mean is absolute high-low divided by absolute mean.
| Metric | Period | Mean | Low–high | Spread/mean | Analysts |
|---|---|---|---|---|---|
| Revenue | FY2027E | $1.07bn | $943.98m–$1.19bn | 22.9% | 12 |
| EBITDA | FY2027E | $425.96m | $384.30m–$491.20m | 25.1% | 10 |
| Net income (GAAP) | FY2027E | $305.30m | $243.63m–$349.60m | 34.7% | 12 |
Street snapshot
Consensus recommendation score is 1.8 (toward buy); the target mean is $56.93 and median $57.
Currency: USD · Scale: money in millions, absolute · Analyst counts shown explicitly.
| Street view | Reading | Analysts |
|---|---|---|
| Recommendation mix | Buy 8, Outperform 2, Hold 5, Underperform 0, Sell 0 | 15 |
| Consensus score | 1.80 | 15 |
| Target price | mean $56.93; median $57.00; high $90.00; low $42.00 | 15 |
Coverage thins sharply beyond FY2027
FY2028 revenue carries just 5 estimates and EBITDA only 3; FY2029 has a single normalized-EPS estimate and little else. Treat outer-year figures as indicative.
Visible Alpha broker models via S&P Xpressfeed · 14 brokers · 313 line items · freshest revision 2026-07-20.
ECC trading overtakes as modeled crypto contribution collapses ~61% in FY26
| Line | FY-2025A | FY-2026E | FY-2027E | FY-2028E | YoY | Brokers |
|---|---|---|---|---|---|---|
| Total | — | — | — | — | — | — |
| Net contribution | $861.15m | $955.54m | $1.06bn | $1.16bn | +11.0% | 14 |
| Trading | — | — | — | — | — | — |
| Net trading contribution | $545.86m | $615.36m | $675.98m | $710.09m | +12.7% | 12 |
| Net trading contribution (Equities, commodities and currencies) | $371.62m | $548.56m | $581.23m | $600.44m | +47.6% | 13 |
| Net trading contribution (Cryptoassets) | $173.83m | $67.65m | $93.36m | $109.65m | -61.1% | 12 |
| Interest | — | — | — | — | — | — |
| Net interest contribution | $215.80m | $208.14m | $233.80m | $265.03m | -3.5% | 12 |
| Other | — | — | — | — | — | — |
| eToro money contribution | $85.47m | $118.84m | $136.88m | $158.04m | +39.0% | 12 |
| Subscriptions & others | $12.45m | $14.10m | $19.01m | $26.31m | +13.3% | 12 |
Where broker models disagree
The rebound in crypto contribution, volume and trades is unsettled; brokers agree crypto fell but not how far it recovers. ECC, by contrast, clears with a single-digit IQR.
| Line | Period | Median | Q1–Q3 | Min–max | Brokers |
|---|---|---|---|---|---|
| Net trading contribution (Cryptoassets) | FY-2027E | $92.50m | $71.64m–$111.60m | $47.12m–$148.95m | 11 |
| Net trading contribution (Cryptoassets) | FY-2028E | $100.71m | $86.92m–$142.02m | $49.02m–$159.94m | 7 |
| Cryptocurrencies volume($B) | FY-2027E | $11.59bn | $10.26bn–$13.49bn | $8.46bn–$14.90bn | 7 |
| Cryptocurrencies trades(M#) | FY-2027E | 47.40m Number | 39.87m Number–55.74m Number | 28.10m Number–60.00m Number | 10 |
The scale engine: ECC volume and funded accounts fund the mix shift
ECC volume rises toward ~$210B by FY27 on a growing funded-account base and rising AUA per account. Crypto volume and trades sit below FY25 across the horizon — the crypto contribution weakness is a volume story, not just a take-rate one.
| Line | FY-2025A | FY-2026E | FY-2027E | FY-2028E | YoY | Brokers |
|---|---|---|---|---|---|---|
| Accounts | — | — | — | — | — | — |
| Funded accounts(M#) | 3.81m Number | 4.31m Number | 4.74m Number | 5.23m Number | +13.3% | 12 |
| Assets under administration (AUA)($B) | $19.49bn | $22.07bn | $27.01bn | $31.81bn | +13.2% | 5 |
| AUA per account($) | $5,113 | $5,040 | $5,602 | $6,030 | -1.4% | 5 |
| ECC | — | — | — | — | — | — |
| ECC volume($B) | $157.49bn | $182.23bn | $210.10bn | $208.49bn | +15.7% | 9 |
| ECC trades(M#) | 531.38m Number | 794.01m Number | 842.82m Number | 874.58m Number | +49.4% | 13 |
| Crypto | — | — | — | — | — | — |
| Cryptocurrencies volume($B) | $16.12bn | $9.12bn | $11.78bn | $13.19bn | -43.4% | 10 |
| Cryptocurrencies trades(M#) | 59.22m Number | 40.58m Number | 46.23m Number | 48.62m Number | -31.5% | 12 |
Blended economics compress: effective fee rate to ~0.6% and NIM to ~2.6%
The blended fee rate and net interest margin both step down and hold, and crypto's per-trade contribution never returns to its FY25 level. Growth therefore leans on more accounts and volume rather than richer economics per unit.
| Line | FY-2025A | FY-2026E | FY-2027E | FY-2028E | YoY | Brokers |
|---|---|---|---|---|---|---|
| Blended | — | — | — | — | — | — |
| Effective fee rate - eToro(%) | 0.8% | 0.6% | 0.6% | 0.6% | -0.2pt | 11 |
| Net interest margin(%) | 3.0% | 2.7% | 2.6% | 2.6% | -0.3pt | 12 |
| Take rate | — | — | — | — | — | — |
| Cryptocurrencies take rate(%) | 1.1% | 0.8% | 0.9% | 1.0% | -0.2pt | 9 |
| ECC take rate(%) | 0.2% | 0.3% | 0.3% | 0.3% | +0.1pt | 9 |
| Per trade | — | — | — | — | — | — |
| Contribution per trade - Crypto($) | $2.91 | $1.71 | $2.13 | $2.29 | -41.0% | 11 |
| Contribution per trade - ECC($) | $0.70 | $0.68 | $0.68 | $0.69 | -2.4% | 13 |
| Per user | — | — | — | — | — | — |
| Average contribution per user($) | $236.0 | $233.2 | $237.4 | $237.2 | -1.2% | 12 |
KPI lines rest on far fewer brokers than the headline
AUA is modeled by five brokers and the crypto-AUA line by a single analyst — treat it as one view, not consensus. Broker counts on volumes, take rates and FY28 generally drop to 3–7, and the freshest revisions cluster around mid-July 2026.
Headline P&L consensus, momentum and beat/miss live in the CapIQ tab.
Source: S&P Capital IQ transcripts via Xpressfeed · latest indexed call 2026-05-12 · generated 2026-08-01.
Latest call digest
eToro Group Ltd., Q1 2026 Earnings Call, May 12, 2026 · 2026-05-12T12:30:00
eToro's Q1 2026 call (May 12, 2026) was its fourth as a public company and, by the metrics management led with, its strongest: net contribution up 19% year-over-year to $258 million, adjusted EBITDA up 35% to $109 million at a 42% margin, funded accounts over 4 million (+12%) and AUA of $17 billion. Prepared remarks leaned on two threads — a company-wide AI/agentic push (Agent Portfolios, an App Store, and the Zengo self-custodial-wallet acquisition) and the continued rotation of trading from crypto into commodities, which management said made up 60% of trading commission in the quarter. The Q&A was less about the headline print and more about durability. Analysts pressed on whether the commodity-driven strength and elevated capture rates are sustainable while crypto stays soft, on the economics of agentic trading (management likened it to copy trading — lower take rate, higher velocity, smaller size), on how excess cash is split between buybacks and an active M&A pipeline, and on the timing of the U.S. CopyTrader and Smart Portfolio rollout. Guidance actually stated was limited: marketing scaling toward 25% of net contribution, revenue per trade slightly above the usual $0.60 to $0.75 range, and full U.S. rollout expected in H2.
Participant coverage from the latest call.
| Group | Participants | Count |
|---|---|---|
| Management | Daniel Amir — Head of Global Investor Relations, eToro Group Ltd.; Jonathan Assia — Co-Founder, Chairman of the Board & CEO, eToro Group Ltd.; Meron Shani — Chief Financial Officer, eToro Group Ltd.; Operator | 4 |
| Analysts | Daniel Fannon — Senior Equity Research Analyst, Jefferies LLC, Research Division; Devin Ryan — MD, Director of Financial Technology Research & Equity Research Analyst, Citizens JMP Securities, LLC, Research Division; Joseph Vafi — Analyst, Canaccord Genuity Corp., Research Division; Edward Engel — Research Analyst, Compass Point Research & Trading, LLC, Research Division; Divyam Harlalka — Research Analyst, Goldman Sachs Group, Inc., Research Division; James Friedman — Senior Analyst, Susquehanna Financial Group, LLLP, Research Division; Brian Bedell — Director in Equity Research, Deutsche Bank AG, Research Division; John Todaro — Senior Analyst, Needham & Company, LLC, Research Division; Dan Dolev — MD & Senior Equity Research Analyst, Mizuho Securities USA LLC, Research Division | 9 |
Curated latest-call exchanges; one row per analyst topic.
| Analyst | Firm | Topic | What changed in Q&A |
|---|---|---|---|
| Daniel Fannon | Jefferies | Sustainability of the crypto-to-commodities shift and capture rates | Asked whether the move toward commodities is structural or temporary; management framed it as market-driven volatility within its multi-asset model and said revenue per trade is running slightly above the usual $0.60 to $0.75 range. |
| Devin Ryan | Citizens JMP | Balance-sheet optionality — buybacks versus M&A | Pushed on deploying the large cash position; management pointed to two acquisitions announced in the prior two weeks, a strong M&A pipeline it says the crypto downturn makes more accretive, and continued buybacks. |
| Edward Engel | Compass Point | Agent Portfolio take rate and trading-volume impact | Management said agentic trading resembles copy trading — a lower take rate offset by higher velocity in smaller size — and cited north of 500,000 trades in roughly three weeks since launch. |
| James Friedman | Susquehanna | How much 24/5 and 24/7 trading adds to volume | Management said about 30% of stock volume shifted to after-market hours but explicitly could not say how much of that is additive versus substitute; a candid non-quantification. |
| Brian Bedell | Deutsche Bank | Zengo revenue contribution and converting its user base | Management called it early days and framed Zengo mainly as a way to expand crypto market share and product coverage rather than a near-term revenue driver. |
| Divyam Harlalka | Goldman Sachs | Status of CopyTrader in the U.S. | Management said CopyTrader is in limited rollout and in discussions with regulators, with the RIA-based Smart Portfolios also in process, and both expected in complete rollout in H2. |
Theme tracker
Themes are curator-classified across supplied calls.
| Theme | Status | Quarters mentioned | Read-through |
|---|---|---|---|
| Crypto-to-capital-markets rotation as multi-asset resilience | persisted | Q2 2025, Q3 2025, Q4 2025, Q1 2026 | The central recurring narrative every call: when one asset class cools, activity rotates. Crypto led in Q3 2025 (+229% YoY), then faded while commodities surged to 60% of trading commission by Q1 2026. Management consistently uses it to argue the model performs across market conditions. |
| AI and agentic trading | persisted | Q2 2025, Q3 2025, Q4 2025, Q1 2026 | Present from the first public call (Tori launch) and escalating each quarter — apps and AI studio in Q3, 'AI-first company' in Q4, and a company-wide AI mandate plus Agent Portfolios and an App Store in Q1 2026. The framing has moved from a tool to the core operating and product engine. |
| Share buybacks and capital return | emerged | Q3 2025, Q4 2025, Q1 2026 | Emerged in Q3 2025 with a $150M authorization and 'stock is undervalued' language, raised by $100M to $250M total in Q4, and executed in Q1 2026 ($103M repurchased). A new pillar tied explicitly to a perceived share-price gap. |
| M&A pipeline | persisted | Q2 2025, Q3 2025, Q4 2025, Q1 2026 | Discussed as an active-but-disciplined pipeline every call and finally materialized in Q1 2026 with the Zengo and B2C (Israel crypto exchange) acquisitions; management argues the crypto downturn improves deal accretion. |
| U.S. expansion and CopyTrader rollout | persisted | Q2 2025, Q3 2025, Q4 2025, Q1 2026 | A standing multi-quarter build: CopyTrader promised for the U.S. in Q2, launched in October (Q3 call), with the RIA-based Smart Portfolios and full CopyTrader rollout repeatedly pushed to H1/H2 2026. |
| Marketing step-up toward 25% of net contribution | emerged | Q4 2025, Q1 2026 | New guidance introduced in Q4 2025 to scale sales and marketing from about 21% toward 25% of net contribution during 2026; Q1 2026 ran at 22%, tracking the plan. |
| Prediction markets | emerged | Q3 2025, Q4 2025, Q1 2026 | Surfaced in Q3 2025 (futures rails, Kalshi/Polymarket talks) and recurred through Q1 2026 via the Zengo wallet and a U.S. NFA-regulated path; still described as early and largely partnership-driven. |
Guidance ledger
Quotes, calls, and speakers are source-verified; outcomes are curator-classified.
| Verbatim guidance | Call | Speaker | Curator outcome | Outcome note |
|---|---|---|---|---|
| “we plan to launch a CopyTrader for U.S. customers on crypto and stocks later this year” | eToro Group Ltd., Q2 2025 Earnings Call, Aug 12, 2025 · 2025-08-12T12:30:00 | Jonathan Assia | kept | eToro announced the launch of Copy Trading in the U.S. in October 2025, disclosed on the Q3 2025 call. |
| “we're aiming to keep our cost base the same quarter-on-quarter. And indeed, we came with a flat view. So we are roughly looking at staying within those lines also in Q4” | eToro Group Ltd., Q3 2025 Earnings Call, Nov 10, 2025 · 2025-11-10T13:30:00 | Jonathan Assia | kept | Q4 2025 adjusted OpEx was $140 million, roughly flat versus Q3's $137 million. |
| “we plan to increase our sales and marketing investment from 21%, scaling gradually to 25% of net contribution” | eToro Group Ltd., Q4 2025 Earnings Call, Feb 17, 2026 · 2026-02-17T13:30:00 | Meron Shani | pending | A 2026 target; Q1 2026 sales and marketing was 22% of net contribution, with the 25% goal reiterated. |
| “We are expecting double-digit account growth” | eToro Group Ltd., Q4 2025 Earnings Call, Feb 17, 2026 · 2026-02-17T13:30:00 | Jonathan Assia | pending | A 2026 target; Q1 2026 funded accounts grew 12% year-over-year to over 4 million, tracking the goal with the full year incomplete. |
| “we don't expect that to deviate much from the usual 1% that we have delivered so far” | eToro Group Ltd., Q4 2025 Earnings Call, Feb 17, 2026 · 2026-02-17T13:30:00 | Meron Shani | unknown | Refers to the crypto take rate after a Q4 dip to 0.7%; Q1 2026 did not disclose a crypto take rate, so the outcome is not verifiable from the call history. |
| “we do expect both to be in complete rollout in H2” | eToro Group Ltd., Q1 2026 Earnings Call, May 12, 2026 · 2026-05-12T12:30:00 | Jonathan Assia | pending | Refers to U.S. CopyTrader and Smart Portfolios; H2 2026 had not elapsed as of the last call in the supplied history. |
Q&A pressure map
Question counts and firms are curator tallies; analyst coverage shown above.
| Topic | Questions | Firms | Pressure / response |
|---|---|---|---|
| Crypto/commodities rotation and take-rate sustainability | 11 | Jefferies, Goldman Sachs, Cantor Fitzgerald, FT Partners, Mizuho, Compass Point, Canaccord, Needham | The most persistent line of questioning across all four calls: whether shifting activity between crypto and commodities is durable and what it does to take rates. Management repeatedly reframed it as multi-asset resilience rather than answering the sustainability question directly. |
| U.S. expansion, CopyTrader rollout and licensing | 9 | TD Cowen, Canaccord, Rothschild & Co Redburn, UBS, Deutsche Bank, Goldman Sachs, Citizens JMP | Analysts pressed each quarter on U.S. traction, CopyTrader mechanics and the RIA/fiduciary licensing timeline. Answers stayed qualitative — 'early days,' rollout targeted for H1/H2 2026 — with little quantification of U.S. uptake. |
| AI and agentic trading impact on volumes | 7 | Citizens JMP, Mizuho, Compass Point | Recurring questions on whether AI and agentic tools produce a step-change in trading. Management is consistently bullish on velocity but has offered mostly directional evidence (e.g., early Agent Portfolio trade counts) rather than sized volume or revenue effects. |
| Capital allocation — buybacks versus M&A | 4 | Citi, UBS, Compass Point, Citizens JMP | With the stock seen as undervalued, analysts probed how excess cash is prioritized. Management held to 'both' — disciplined, accretive M&A alongside ongoing buybacks — without a fixed allocation framework. |
Language shifts
Only language evidence verified against the referenced component is shown.
| Observation | Verbatim evidence | Call ID | Component |
|---|---|---|---|
| As crypto trading contribution fell sharply, management shifted from Q3's bullish 'strong crypto market' framing to a defensive build-through-the-downturn stance. | “crypto downtimes are the time to build” | 1994107075 | 1 |
| Management began directly addressing share-price weakness, introducing explicit undervaluation language alongside the first buyback authorization in Q3 2025. | “We believe that our stock is undervalued.” | 1964400789 | 1 |
| AI language intensified from Q2's 'inflection point' to a company-wide operating mandate by Q1 2026, now positioned as core to how the business runs, not just a feature. | “we made AI a company-wide mandate across every function in eToro” | 1994107075 | 1 |
| A new cost-discipline note surfaced in Q4 2025: the first disclosure of a headcount reduction, tied to AI-driven efficiency and scaling without adding to the cost base. | “We did do about a month ago an adjustment to headcount as well.” | 1979238227 | 21 |
Across its first year as a public company, eToro's call history tells a consistent story: commodities and capital-markets activity have offset a steep crypto downturn, keeping net contribution and margins growing while management leans harder on AI, buybacks and now M&A. The open debate is durability — whether commodity-led strength and the agentic roadmap are sustainable enough to carry through crypto's cyclicality and justify the marketing step-up, at a valuation management itself calls too low.
The eToro Setup
eToro is a founder-controlled, net-cash retail investment platform that listed on Nasdaq in May 2025 and now trades roughly a third below its offer price. It is genuinely profitable — $216 million of net income in 2025 [1] — but that profit rides retail-trading and crypto cycles, and the same platform reported a $215 million loss as recently as 2022 [2]. This chapter orients a cold reader and fixes the question the rest of the report answers.
What the business is
eToro operates a multi-asset "social investing" platform: retail users trade stocks, ETFs, cryptoassets, commodities and currencies, and — through its patented CopyTrader tool — can automatically mirror the portfolios of other users. The company was founded in 2007 by brothers Yoni and Ronen Assia, remains founder-led, and offered bitcoin trading in the EU as early as 2013 [3]. At the end of 2025 it served approximately 3.81 million Funded Accounts — users who have completed onboarding, deposited and traded — across 75 countries [4].
Funded Accounts (M)
Net Contribution ($M, FY2025)
Net Income ($M, FY2025)
Net Cash ($M)
Sources: Funded Accounts and Net Contribution — FY2025 20-F [5] [6]; net cash derived from the FY2025 balance sheet [7].
The top line that isn't a top line
eToro's income statement reports $13.8 billion of "revenue" for 2025, of which $13.0 billion is "Revenue from cryptoassets" [8]. That figure is not what the business keeps. eToro books the full notional value of each crypto trade as revenue and nets an almost identical cost of revenue immediately below it. The measure that reflects what the platform actually earns from user activity is Net Contribution — total revenue and income less the cost of crypto revenue and margin interest expense — which was $868 million in 2025 [9].
The gap matters for a first-time reader: cryptoassets are about 94% of gross revenue but, by eToro's own component split, roughly a fifth of Net Contribution. On the gross line eToro looks like a crypto exchange; on Net Contribution it looks like a diversified retail broker with a crypto business inside it. The rest of this report uses Net Contribution, not gross revenue, as the scale of the business.
Three years of earnings, and one cycle to remember
On Net Contribution, eToro has grown steadily — $557 million in 2023, $787 million in 2024, $868 million in 2025 [10]. Net income tells a more geared story. It was $15 million in 2023, $192 million in 2024 and $216 million in 2025 [11] — and a $215 million net loss in 2022, the year crypto markets collapsed [12].
Source: 2022 net loss of $215 million — Final Prospectus [13]; 2023–2025 — FY2025 20-F [14].
Two years separate a $215 million loss from a $216 million profit. That swing frames how to read eToro's earnings: net income is highly geared to Net Contribution, which in turn moves with retail trading appetite and, above all, with crypto. In 2023, on Net Contribution of $557 million, the company kept $15 million; in 2025, on $868 million, it kept $216 million. Most of the incremental Net Contribution dropped to the bottom line — which is the good news in an up-cycle and the warning in a down-cycle. A dedicated financials-and-estimates chapter should carry the full three-year statements and forward consensus; this chapter establishes only the shape.
Where Net Contribution comes from
eToro frames its diversification across five components. Equities, commodities and currencies is the largest and steadiest — $400 million in 2025. Net interest income, earned on user cash and margin balances, has grown every year to $217 million. Crypto trading is the swing factor: $56 million in 2023, $193 million in 2024, $155 million in 2025 [15].
Source: FY2025 20-F, Net Contribution and Components [16].
The diversification is real and it is eToro's central defense against the crypto-cycle read: a quarter can lean crypto or lean equities depending on where the volatility is. But the components are correlated to one common driver — retail engagement — and crypto is still the most volatile line within it. Crypto trading contribution swung from $95 million in the fourth quarter of 2024 to $26 million in the fourth quarter of 2025 [17]. Diversification softens the cycle; it does not remove it.
The balance sheet floor
For a reader who wants the chance of bankruptcy near zero, the balance sheet is the reassuring part of the story. At the end of 2025 eToro held $1.07 billion of cash and cash equivalents [18], plus roughly $0.2 billion of short-term investments, against no debt and total liabilities of about $0.4 billion. Shareholders' equity was roughly $1.39 billion. The company generated $313 million of free cash flow in 2025 and has never carried meaningful leverage.
Capital return has already started. The board authorized a $150 million buyback in 2025 and expanded it by $100 million in February 2026; by year-end 2025 the company had repurchased about $62 million of stock [19]. A net-cash, cash-generative platform buying back stock below its IPO price is a materially different risk profile from the highly leveraged brokers that have failed in past cycles.
Ownership, control and pay
eToro is founder-controlled through a dual-class structure. Class B shares carry ten votes each; pre-IPO holders, led by CEO and co-founder Yoni Assia, hold all of them and together control approximately 68% of the voting power [20]. Directors and executive officers as a group hold about 35% of the vote; regulatory rules cap any single holder — including Yoni Assia — at 9.99% of voting power, so control is collective rather than absolute [21].
The skin in the game is genuine: Yoni Assia beneficially owns about 7 million shares [22] — worth roughly a quarter of a billion dollars at the current price — and total compensation for all directors and named executives combined was just $7.5 million in 2025 [23]. Founder alignment cuts both ways for a minority investor — it concentrates decision-making and can block a takeover premium — and a dedicated management-and-ownership chapter should test it properly. For orientation: this is an owner-operator, not a hired-management, situation.
The price the market is putting on it
eToro priced its IPO at $52.00 per share on May 15, 2025, selling 13.7 million Class A shares and raising net proceeds of $378 million for the company [24]. The stock closed at $35.67 on July 31, 2026 — about 31% below the offer price, and well under the analyst mean target near $57.
Price (Jul 31 2026)
P/E (trailing, diluted)
P/E (2026E consensus)
EV / Adj. EBITDA
Sources: price and consensus estimates — market data as reported; earnings and EBITDA — FY2025 20-F [25]; ratios derived at the July 31, 2026 close.
On roughly 82.9 million common shares the equity is worth about $3.0 billion; stripping out ~$1.28 billion of net cash leaves an enterprise value near $1.7 billion — about 5.4 times 2025 Adjusted EBITDA of $317 million and under 8 times net income [26]. Trailing P/E is in the mid-teens and the 2026 consensus multiple is around 13 times. Whatever else eToro is, it is not priced as a high flyer. The tension is that these are trough-cheap multiples on what may be peak-cycle earnings.
Tailwinds behind the platform
The structural case eToro leans on is the long rise of retail participation: retail investors accounted for about 52% of global assets under management in 2021, projected to exceed 61% by 2030, and younger cohorts start investing far earlier than prior generations [27]. The industry-tailwinds question — how much of eToro's growth is the rising tide versus share gain, and how durable the crypto-adoption leg is — deserves its own chapter; this one only registers that the platform has a real secular wind behind it.
The through-line
The question this report exists to answer: is eToro's post-2023 profitability — earned on a net-cash balance sheet under founder control, but geared to a Net Contribution that still rises and falls with retail trading and crypto activity — durable enough to make its low-teens earnings multiple, struck below the IPO price, a genuine margin of safety, or is 2025 a cycle high the market will re-rate lower when trading activity next contracts?
The evidence for the constructive read is on the page: a fortress balance sheet that all but removes bankruptcy risk, an owner-operator with a quarter-billion dollars of his own money at stake, diversification that has already let equities carry the platform when crypto cooled, and a valuation that does not demand heroic growth. The strongest fact against it is the 2022 loss, which shows this earnings stream can not merely slow but reverse. What would decide it is whether Net Contribution holds near current levels through the next crypto and retail-trading downturn, or falls back toward its 2023 base. The chapters that follow test the pieces of that question in turn.
Financials and Estimates
eToro's three-year record is a genuine inflection. Net Contribution — the platform's economic top line — rose from $556 million to $868 million, net income from $15 million to $216 million, and Adjusted EBITDA from $117 million to $317 million, on a debt-free, cash-generative balance sheet [1]. Consensus sees Net Contribution near $1.07 billion and diluted EPS of $3.35 by 2027. Two things temper the trend: 2025's pre-tax profit barely grew, and reported net-income growth leaned partly on a falling tax rate.
The three-year record
The headline revenue line — $13.8 billion in 2025 — is gross cryptoasset notional and is not the number to reason from; the economics live in Net Contribution, which strips out the near-offsetting cost of crypto revenue and margin interest (The eToro Setup) [2]. The bridge from that gross line down to net income shows where the money actually accrues.
Source: FY2025 Annual Report (Form 20-F), Consolidated Statements of Income; Net Contribution per management's definition [3] [4].
The operating leverage is real but uneven. Net Contribution grew 56% across the two years, while operating costs — research, marketing, and general expense — grew 16%, so pre-tax income went from $28 million to $253 million [5]. Most of that gearing landed in 2024. In 2025, Net Contribution added $81 million but operating costs added $73 million — marketing rose $30 million and research and development $20 million — so pre-tax profit rose only $8 million, from $246 million to $253 million [6]. Reported net income still grew 12%, to $216 million, because the effective tax rate fell from 21.7% to 14.9%. The step from a $215 million loss in 2022 to a $216 million profit in 2025 is a real turnaround, but the pre-tax plateau is the first thing a skeptic should note [7].
Source: FY2025 Annual Report (Form 20-F), income statement and Adjusted EBITDA reconciliation [8] [9].
The durable base and the crypto swing
Net Contribution is not one stream but five, and how they moved is the heart of the durability question the report is built around [10]. The crypto-trading component is the volatile one — it swung from $56 million in 2023 to $193 million in 2024, then fell to $155 million in 2025. Everything else rose steadily.
Source: FY2025 Annual Report (Form 20-F), Net Contribution and Components (quarterly figures summed to annual) [11].
Set crypto trading aside and the remaining base — equities/commodities/currencies, net interest, eToro Money, and subscriptions — went from $501 million in 2023 to $713 million in 2025, up 20% in the most recent year alone [12]. All of 2025's Net Contribution growth came from that base; crypto trading actually shrank. On the evidence, the platform's monetization is more diversified than the "crypto brokerage" label implies: crypto trading was 25% of Net Contribution at its 2024 peak and 18% in 2025 [13].
The pattern beneath that is rotation across asset classes, not crypto immunity. eToro's 2025 Net Contribution growth came entirely from its non-crypto base of $713 million even as crypto-trading contribution fell to $155 million, and by Q1 2026 it set a record $258 million of Net Contribution with crypto down to about $13 million because capital-markets contribution rose 71% to a record $166 million [14] [15] [16].
That framing has a real limit worth stating in the same breath. Net interest contribution — the second-largest component at $217 million, or 25% of the total — is a function of the short-term rates eToro earns on client and corporate cash, and it has grown partly because rates were high [17]. So the "durable base" carries its own cyclicality — to interest rates rather than crypto. A crypto-trading reversion to the 2023 level would subtract roughly $99 million from Net Contribution (about 11%), leaving it near $770 million — still well above 2023's $556 million — but a simultaneous fall in both crypto activity and rates is the scenario the mid-teens multiple would need to withstand.
Earnings quality
The profit turns into cash, and the quality is improving as the business de-risks its own accounting. Free cash flow was $313 million in 2025 against $216 million of net income — 1.4 times conversion — and the business is asset-light, spending roughly $5 million a year on capex [18].
Source: FY2025 Annual Report (Form 20-F), Consolidated Statements of Cash Flows [19].
Two adjustments show the earnings getting cleaner rather than dirtier. The gap between Adjusted EBITDA and net income is narrowing as share-based payment — the largest add-back — fell from $66 million in 2023 to $16 million in 2025, the run-off of pre-IPO grant expense [20]. At $317 million, Adjusted EBITDA sits only $101 million above net income, and most of that is real tax and finance cost, not aggressive add-backs [21]. The offsetting caution is the tax line: the 14.9% effective rate in 2025, down from 21.7%, flattered net income, and it is not a rate to extrapolate [22].
Free Cash Flow 2025
FCF / Net Income
Share-Based Pay 2025
Effective Tax Rate 2025
Source: FY2025 Annual Report (Form 20-F), income statement, cash-flow statement, and Adjusted EBITDA reconciliation; FCF/net income and tax rate derived from reported figures [23] [24] [25].
The balance sheet floor
For a reader whose first fear is bankruptcy, the balance sheet is the reassuring part of the file. At the end of 2025 eToro held $1.07 billion of cash plus $203 million of short-term investments — roughly $1.28 billion of liquid corporate assets — against no financial debt [26]. A $250 million senior revolving facility, signed in June 2025, is undrawn, and the company terminated its earlier bank line entirely [27].
Liquid Assets
Payable to Users
Financial Debt
Shareholders' Equity
Source: FY2025 Annual Report (Form 20-F), Consolidated Statements of Financial Position; equity derived as total assets less total liabilities [28].
The net-cash read holds up to the obvious challenge — that the cash belongs to users, not shareholders. Amounts payable to users were $108 million, and restricted cash was $12 million; the bulk of the $1.28 billion is corporate [29]. Shareholders' equity was roughly $1.39 billion. With liquid assets near $1.28 billion, a large share of eToro's market value is backed by cash — the margin-of-safety floor the through-line depends on, and the reason a repeat of 2022's loss would dent earnings without threatening solvency [30].
What the estimates say
Sell-side coverage — 11 to 15 analysts — expects the growth to continue at a slower, steadier pace. Consensus has Net Contribution rising about 11% to $968 million in 2026 and another 10% to roughly $1.07 billion in 2027. Diluted EPS is seen at $2.84 and $3.35 over the same years, against $2.27 delivered in 2025.
Source: consensus of 11–15 sell-side analysts, as reported; FY2025 actuals per the FY2025 20-F income statement [31].
The shape of these estimates carries the assumption a value buyer should test: consensus EPS growth (25% then 18%) runs well ahead of Net Contribution growth (11% then 10%), so the forward case leans on margin expansion and share buybacks resuming the operating leverage that flattened in 2025 — not just more trading activity. The counter-evidence for the near term is encouraging: first-quarter 2026 results, reported in May 2026, showed Net Contribution of $258 million (up 19% year over year), net income of $82 million (up 37%), and Adjusted EBITDA of $109 million (up 35%) — a record quarter that suggests the leverage can return when activity is firm [32].
Price (Jul 31 2026)
Mean Target
Implied Upside
Source: consensus price targets and current price, as reported (mean of 15 analysts; ratings 8 buy, 2 outperform, 5 hold, 0 sell).
At $35.67, the stock trades below its $52 IPO price and at roughly 13 times 2026 consensus EPS, with a mean analyst target of $57 — about 60% above the current quote, and no sell ratings against ten positive ones. Whether that gap is a margin of safety or a cyclical trap: the case is most sensitive to how much of the 2024–25 step-up is a durable, rate- and equity-driven base, and how much reverts when crypto activity and interest rates next turn down. The financials say the base is growing and the balance sheet removes the tail risk; the estimates say the market is pricing a slowdown, not a collapse.
Control and Alignment
eToro presents as a founder-controlled, dual-class company, but the control is more diffuse — and more aligned with outside shareholders — than the structure suggests. A regulatory 9.99% cap means no single holder, not even co-founder and CEO Yoni Assia, can vote more than that; the super-voting Class B bloc has shrunk from 88.9% of the vote at listing to roughly 67% as departing holders' shares auto-converted; and insider pay is modest cash against a large, deep-in-the-money equity stake. The offsets are a combined chair/CEO, a staggered board, and foreign-private-issuer disclosure gaps.
Who owns eToro
As of February 20, 2026, eToro had 66,806,751 Class A shares (one vote each) and 13,739,582 Class B shares (ten votes each) outstanding [1]. Directors and officers as a group hold about 22% of the economics but 35% of the vote — meaningful influence, well short of majority control. No individual, including Yoni Assia, votes more than 9.99% [2].
Source: FY2025 Annual Report (Form 20-F), Item 7.A Major Shareholders, beneficial-ownership table as of Feb 20, 2026 [3].
The table shows two distinct stories. Yoni Assia holds roughly 8.6% of the shares but, on paper, ten-vote Class B stock that would carry far more than 9.99% of the vote; the cap holds him to 9.99% [4]. Santo Politi's Spark Capital position is the mirror image — about 8.9% of the economics but only 3.5% of the vote, because it is all single-vote Class A. Founder economic ownership is real but not dominant: the two Assia brothers together hold roughly 11.5% of the shares.
The 9.99% cap and a dual-class that is thinning
Two mechanics separate eToro from a conventional founder-locked dual-class listing. The first is regulatory. Because eToro is a licensed financial-services group, its charter deems any shares above 9.99% of combined voting power "Excess Shares" that carry no vote and no right to distributions unless a regulator approves the larger holding [5]. That is why both Yoni Assia and BRM Group appear at exactly 9.99% rather than higher. The concentration a ten-to-one vote ratio would normally produce is capped by design.
The second is conversion. Class B shares automatically convert one-for-one into Class A on almost any transfer, and the whole class sunsets — converting to Class A — no later than May 13, 2035, or earlier if the Class B pool falls below 15% of its IPO-date size [6]. That conversion is already visible. At the May 2025 IPO, Class B represented about 88.9% of the vote [7] and comprised 36.5 million shares [8]. Nine months later the Class B count had fallen to 13.7 million and its share of the vote to roughly 67% [9]. As pre-IPO holders sold, their super-voting stock converted to ordinary shares.
Class B share of votes (Feb 2026)
Insiders' combined vote
Largest single vote (capped)
Sources: derived from the Feb 2026 beneficial-ownership table (share counts and combined-vote percentages) [10].
Sources: IPO Prospectus (Form 424B4), The Offering — 88.9% at listing [11]; FY2025 Form 20-F, Item 7.A — share counts as of Feb 20, 2026 [12].
The same drift shows in the insider bloc: directors, officers and principal shareholders held about 52% of the vote at the IPO and roughly 35% by February 2026 [13]. For a professional investor the practical read is that founder control here is a board-and-influence story, not a hard voting lock, and the lock loosens further each year the Class B pool converts. The counter-consideration is that even a diluted super-vote plus a combined chair/CEO leaves outside holders with limited ability to force change, and the multi-class structure makes eToro ineligible for the main U.S. large-cap composite indices, foreclosing a slice of passive demand [14].
The board and its offsets
Five of seven directors qualify as independent under Nasdaq rules, but Yoni Assia serves as both chairman and CEO, and the board is staggered into three classes with three-year terms — an entrenchment feature that slows any change of control [15]. With the roles combined, the independent directors have named Avner Stepak as Lead Independent Director; as a foreign private issuer, eToro follows British Virgin Islands home-country practice and is not required to maintain a majority-independent board at all [16]. The independent slate does carry relevant weight — it includes Laura Unger, a former SEC Commissioner and acting chair [17].
The related-party footnotes are small in dollars but worth noting for a founder-led company. eToro has repeatedly waived its right of first refusal on employee share transfers to iAngels, a firm whose CEO and owner is Yoni Assia's spouse and whose board includes his father [18]. Director Lior Shemesh is CFO of Wix.com, to which eToro paid about $23,000 for website services and a further $64,000 to Wix-owned Base44 during 2025 [19]. None is financially material; together they sketch a closely-networked founder ecosystem rather than a governance red flag.
Pay: modest cash, large embedded equity
Total compensation for all directors and named executive officers in 2025 was $7.5 million — a low figure against roughly $216 million of net income, and one eToro is not required to break down by individual because foreign private issuers are exempt from the detailed and per-officer pay disclosure a domestic filer's proxy would carry [20]. The alignment sits almost entirely in equity, not cash.
FY2025 pay, all directors + NEOs
Insider options (shares)
Weighted-avg strike
Est. option intrinsic (~$35.67)
Source: FY2025 Form 20-F, Item 6.B Compensation — aggregate pay and 3,618,488 Class A + 3,831,622 Class B options held by directors and executives at a $6.18 weighted-average strike [21]; intrinsic value derived at a recent ~$35.67 share price.
Directors and executives hold about 7.45 million options struck at a weighted-average $6.18 [22]. At a recent price near $35.67 that is roughly $220 million of embedded gain — about thirty times the annual cash-and-equity pay figure. Insider wealth is therefore tied to the share price, not to salary, which is the alignment a professional investor generally wants to see. The strike also reveals the vintage: these are legacy grants from before the IPO, and management is not repricing itself richer — the 2025 grants came in at about $15 per share [23].
The control and the alignment pull in opposite directions but are both real: insiders' upside is overwhelmingly equity and share-price-linked, while their voting control is capped, thinning, and set to sunset — leaving a combined chair/CEO and a staggered board as the durable levers.
Against that alignment sits dilution. Company-wide, 13,915,798 options were outstanding at year-end 2025 at a $9.18 weighted-average strike, of which 12,317,036 were already exercisable [24]. That is an overhang of roughly 17% on the ~80.5 million shares outstanding. It is not a hidden cost: the gap between eToro's ~80.5 million basic shares and the ~95 million diluted shares behind the $2.27 diluted EPS in the financials is largely this option pool, so the multiple a buyer pays already reflects it.
What would change the read
The alignment case rests on insiders owning share-price-linked equity and taking little cash; it would weaken if future grants reset strikes materially higher, if the aggregate pay figure climbs without a matching move in results, or if the related-party web around the founder grows beyond the immaterial sums disclosed today. The control case cuts the other way: the 9.99% cap and the shrinking Class B pool steadily reduce insider voting power, but a combined chair/CEO on a staggered board means a professional investor should not expect to force strategic change, and index exclusion will keep a segment of passive capital on the sidelines until the dual-class structure sunsets.
eToro sits in a crowded field. Measured by profit, it is a fraction of Robinhood, Coinbase, or Interactive Brokers; measured against the retail leveraged-trading brokers it most resembles, it is the largest by account count and among the fastest-growing. Its differentiation — a social-investing network and a genuinely multi-asset book — is real but narrow, and the industry tailwinds it cites are structural for the category yet shared by every rival and pro-cyclical. The moat defends a niche, not a fortress.
The industry moving its way
eToro's growth rides demand forces that are real and, on the company's own sourcing, sizeable. Global ETF assets grew 27% in 2024 to $14.6 trillion and are projected by PwC to exceed $26 trillion by June 2029; the cryptoasset market capitalization was roughly $3 trillion at the end of 2025 per CoinGecko, and traditional finance and crypto continue to converge as regulation clarifies [1]. Retail participation is rising, and a rung of that demand is flowing to social channels: a 2022 BNY Mellon and World Economic Forum survey found 74% of retail investors would invest more with more opportunity to learn, over 60% of U.S. investors under 35 use social media as a primary source of investment information per the FINRA Investor Education Foundation, and Deloitte projects AI-enabled apps could become the leading source of retail investment advice by 2027 [2].
| Tailwind | Figure |
|---|---|
| Global ETF AUM 2024 (to $26T+ by 2029, PwC) | $14.6T |
| Crypto market cap Dec 2025 (CoinGecko) | ~$3T |
| US under-35s using social to invest (FINRA) | 60%+ |
Sources: FY2025 Annual Report (Form 20-F), Trends in Our Favor [3], [4].
Two qualifications keep these tailwinds from being an edge. They lift the entire field — Robinhood, Coinbase, IG, and every neo-broker cite the same retail-participation and crypto-convergence story — so they explain why the category grows, not why eToro wins inside it. And they are pro-cyclical: the ETF and crypto figures swell in bull markets and reverse in downturns, the same beat that runs through Net Contribution and, from there, to earnings. The tailwinds are a reason the addressable market is large and growing, not evidence that eToro's slice of it is protected.
Where it sits in the field
Against the largest listed platforms, eToro is a small company. Coinbase turned over $7.2 billion of revenue and Interactive Brokers $6.2 billion in net revenues in 2025; Robinhood earned $1.9 billion of net income on $4.5 billion of revenue [5] [6] [7]. eToro's $868 million of Net Contribution and $216 million of net income put it at roughly a sixth of Coinbase's profit and a ninth of Robinhood's [8]. On the metric that matters to a self-directed retail platform — funded accounts — Robinhood's 27.0 million dwarfs eToro's 3.81 million [9] [10].
The comparison changes against the brokers eToro actually resembles. IG Group, CMC Markets, and Plus500 run the same principal-based, multi-asset retail model — market-making across CFDs, equities, and currencies — and here eToro is the leader by scale. IG Group booked £1,075.9 million of revenue (about $1.44 billion) against 820,000 active clients, a figure inflated by its Freetrade acquisition from 346,200 a year earlier; CMC Markets took £360.1 million (about $483 million) from roughly 336,000 active trading and investing clients [11] [12] [13]. eToro's 3.81 million funded accounts are several times the client base of any of them, and its Net Contribution exceeds each — though the CFD peers convert that revenue into higher margins and, unlike eToro, are constrained to a narrower, more leveraged product.
Sources: FY2025 filings — eToro 20-F [14]; Robinhood 10-K [15], [16]; Coinbase 10-K [17]; Interactive Brokers 10-K [18], [19]; IG Group [20]; CMC Markets [21], [22]. GBP converted at £1 = $1.34; account definitions differ by company (funded accounts, active clients, cleared accounts). Coinbase account figure is 9.2m monthly transacting users, not a comparable account stock; IBKR net income is omitted because its consolidated non-controlling-interest structure makes it non-comparable, and its pre-tax income was $4.77 billion.
The monetization gap
The account-count lead comes with a lower yield per account, and that is the more revealing comparison. eToro earned roughly $228 of Net Contribution per funded account in 2025 ($868 million over 3.81 million); Robinhood's own ARPU was $171 [23]. The CFD-centric brokers monetize a smaller base far harder: IG Group and CMC Markets generate on the order of $1,400–1,800 of revenue per active client, and Plus500 likewise runs a small, high-turnover CFD book whose clients are fewer, more active, and more leveraged than eToro's. eToro's economics sit at the mass-market, moderate-yield end of the spectrum — closer to Robinhood than to the leveraged-trading shops — which is the natural read of a platform whose median user is 37 and whose stated purpose is to widen access, not to concentrate turnover among whales [24].
Source: derived from FY2025 filings — eToro NC ÷ funded accounts [25], [26]; Robinhood ARPU as reported [27]; IG [28] and CMC [29] revenue ÷ active clients, GBP at $1.34. Account definitions differ (funded vs active vs cleared); figures are directional.
The moat: social investing and breadth
What eToro has that the field mostly does not is a two-sided social network built into the brokerage. Users can copy the trades of over 4,750 members of a vetted Pro Investor program, invest through 127 curated Smart Portfolios, and trade more than 150 cryptoassets alongside equities on 25 exchanges [30]. CopyTrader — patented and live since 2010 — is the mechanism: more people to copy attracts more copiers, and more copiers create the audience that makes becoming a Pro Investor worthwhile [31]. None of Robinhood, Coinbase, IG, CMC, or Plus500 operates a comparable copy-trading network at scale, and the engagement it produces is unusual: the average user logs in about four times a day for roughly twelve minutes, 92% of users' first action in 2025 was to invest or copy, and 53% of funded accounts hold more than one asset class [32].
| Engagement metric | Figure |
|---|---|
| Pro Investors to copy | 4,750+ |
| Logins per user (~12 min each) | ~4x/day |
| Hold two or more asset classes | 53% |
| Club 3-yr retention (vs 62%) | 72% |
Sources: FY2025 Annual Report (Form 20-F), Our Users and eToro Club [33], [34], [35].
The multi-asset breadth reinforces the social layer and does real work in the P&L. Because a user can hold equities, commodities, currencies, and crypto in one account, no single asset class dictates the relationship, and eToro argues this diversity gives it a more stable financial profile than a single-product broker [36]. The stickiness shows up in the eToro Club: 72% of Club members have held a funded account for three years or more, against 62% for non-members [37]. And the footprint is deliberately where the U.S. giants are weakest: 3.81 million funded accounts across 75 countries, with number-one or number-two brand awareness for trading in its seven key markets — the U.K., Europe, the UAE, and Australia among them [38].
That said, the moat has thin walls, and the disconfirming evidence is specific. Underlying account growth is slow and partly bought: net funded-account additions were about 0.3 million in 2025 and 0.4 million in 2024, and half of the 2024 gain came from the Spaceship acquisition rather than organic demand [39]. Switching costs in brokerage are low, and eToro concedes in its own risk factors that it competes with larger, better-capitalized rivals — Robinhood is adding social and crypto features and expanding into Europe, and low-cost neo-brokers undercut it on price — while the spread of spot crypto exchange-traded products could pull demand away from the direct crypto trading that swings its Net Contribution [40] [41]. The largest and deepest retail pool, the United States, remains largely closed to its CFD and full crypto offering, capping how much of that funded-account lead can compound.
The balance of evidence is that eToro's moat is real but bounded: CopyTrader and multi-asset breadth are a genuine, hard-to-copy differentiator that lifts engagement and retention, but they defend a mid-market, moderate-yield niche outside the U.S. rather than a structural cost or scale advantage over the giants. What would strengthen the read is organic funded-account growth reaccelerating without acquisitions and copied assets holding through a crypto drawdown; what would weaken it is a stall in net additions or Robinhood's international push eroding eToro's European brand lead. The niche is defensible at today's mid-teens multiple; the moat's bounds — a mid-market, moderate-yield position rather than a structural cost or scale advantage over the giants — are what a higher multiple would have to overlook.
Regulatory Exposure
eToro runs a leveraged-derivatives and crypto business across roughly ten regulators, and both product families are under active scrutiny: an ongoing ASIC suit, a settled SEC crypto matter, CySEC inquiries, and CFD pull-outs in Spain and Belgium. Yet the financial damage booked to date is small — a $10.3 million legal provision against $216 million of net income and $1.28 billion of net cash. The case is most sensitive to whether a forced product or geography restriction shrinks the Net Contribution base.
A licensed business, in every sense
eToro is not lightly regulated; it is heavily and redundantly regulated. The group operates fifteen significant subsidiaries incorporated across the British Virgin Islands, Cyprus, Israel, the United Kingdom, the United States, Australia, Malta, Gibraltar, the UAE, the Seychelles and Singapore, each answering to its own supervisor [1]. Management describes the resulting landscape as "extensive, complex, overlapping and constantly changing," and notes plainly that regulators have imposed restrictions on its licenses before and could "impos[e] a total ban on certain activities, including … a ban on cryptoasset transactions, or contracts for difference, as has occurred in certain jurisdictions in the past" [2].
Two product families draw that scrutiny. The first is complex leveraged products — contracts for difference (CFDs) — on which the EEA, the U.K. and Australia require target-market, appropriateness and suitability assessments and have "imposed prohibitions or restrictions." The second is cryptoassets, now governed in the EEA by MiCA (in full effect since December 30, 2024), by a new U.K. regime, by an ASIC crypto-licensing proposal, and in the U.S. by the GENIUS Act (stablecoins, signed July 18, 2025) and the pending CLARITY Act, which "could require [eToro] to become separately regulated by the CFTC" [3].
Those two families are not a side pocket. In 2025, crypto was 29% of eToro's trading commissions, and commodities and currencies — offered to most retail users only as CFDs — were another 25%; equities, part of which are also traded as CFDs, made up the remaining 46% [4].
Source: FY2025 20-F, Composition of Commission from Trading Activities by Asset Class [5]. Commodities and currencies are offered to most retail users as CFDs; crypto is predominantly traded as the underlying asset.
The leverage lever reaches beyond trading spreads. eToro's Net Interest Contribution — $217 million, the largest single component of Net Contribution after equities/commodities/currencies [6] — is generated in part "by charging a fee on margin positions that remain open overnight," i.e. directly on leveraged CFD balances, and in part on interest earned on segregated user cash [7]. A CFD restriction would therefore touch two of the five Net Contribution components, not one — including part of the base a durable-earnings read leans on (Financials and Estimates).
What has actually come due
The scrutiny is not hypothetical; several matters have already resolved or are live. The record so far is one settled U.S. crypto action, one contested Australian CFD suit, a European inquiry, and two voluntary CFD withdrawals.
Sources: FY2025 20-F, Note 18 Commitments and Contingent Liabilities [8]; Risk Factors [9]; ASIC Proceedings [10].
The U.S. matter is the cleanest to read because it is closed. On September 12, 2024, eToro USA LLC settled with the SEC, paid a $1.5 million civil penalty, and limited its U.S. crypto offering to spot Bitcoin, Bitcoin Cash and Ether; management states it "timely paid the penalty and has fully complied," and has "since expanded its cryptoassets offering" without breaching the undertaking [11]. That arc — restricted at the tightest point of the 2024 U.S. enforcement posture, then widened again under a friendlier 2025 regime — is a fair illustration that crypto-regulatory risk runs in both directions.
The Australian matter is the open one. ASIC commenced civil proceedings in August 2023 against eToro AUS Capital Ltd. over its target-market determination for CFDs; the regulator is "seeking … pecuniary penalties as the court determines to be appropriate," and eToro flags that an adverse outcome could invite a class action and give other regulators — CySEC among them — a template to rely on [12]. eToro has already restricted CFDs in Spain and Belgium in response to local regulator positions [13] — evidence that product withdrawals happen, and that the business has absorbed them without visible disruption.
The cost booked is immaterial; the sizing is asymmetric
For a reader whose first test is whether a company can go to zero, the dollar figures settle that question quickly. Against all of the above, eToro carried a total legal provision of just $10.3 million at December 31, 2025 (up from $6.3 million a year earlier), inclusive of the $1.5 million already paid to the SEC [14]. That is under 5% of 2025 net income and a rounding error against the balance sheet.
Legal provisions booked ($M)
SEC penalty paid ($M)
Provisions ÷ 2025 net income
Liquidity cushion ($B)
Sources: legal provisions and SEC penalty — FY2025 20-F, Note 18 [15]; liquidity ($1,073M cash + $203M short-term investments, no financial debt) — Consolidated Statement of Financial Position [16]; net income as reported.
eToro's own conclusion is consistent with the arithmetic: management believes "the resolution of all such pending matters will not, either individually or in the aggregate, have a material adverse effect" [17]. A skeptic should hold that against the fact that the ASIC penalty is genuinely undetermined and that eToro would say this either way — but even a penalty an order of magnitude above the current provision would be absorbed by a single year's free cash flow. The solvency tail this reader watches for is not where the regulatory risk lives.
One adjacent exposure deserves a mention precisely because it is large in gross terms and nil in booked terms: eToro custodies $4.3 billion of user cryptoassets off its balance sheet and records no contingent liability, judging the risk of a security failure "remote" [18]. It is not a profit-and-loss item today, but it is the kind of low-probability, high-severity event — a hack, a custody lapse — that a fine table does not capture.
Structural risk, not the fine
The regulatory risk that could actually move the investment case is a structural one: a rule change that forces eToro to restrict, restructure or withdraw a product or a market, shrinking the Net Contribution base rather than denting a single year's earnings. The precedents already exist in miniature — the Spain and Belgium CFD withdrawals, the 2024 U.S. crypto-scope cut — and the mechanism is spelled out: regulators "may … impos[e] new licensing requirements, or impos[e] a total ban on … contracts for difference" [19].
Two features make this hard to size and worth watching. First, eToro does not disclose Net Contribution by geography or by CFD-versus-underlying: management states it "does not report or analyse income on a customer or country level," so the exact revenue at stake in any one jurisdiction or product is not in the filings [20]. What is known is directional: eToro's brand and user base are concentrated in the U.K., Europe, the UAE and Australia — the same jurisdictions running the tightest CFD regimes — and roughly a quarter of trading commissions come from CFD-only commodities and currencies [21]. The exposure is real; its precise magnitude is not disclosed.
Second, regulation touches the capital stack as well as the product menu. eToro is subject to ESMA capital rules for CFD providers and to MiCA's harmonized capital requirements for crypto-asset service providers, and warns that these "may affect [its] ability to distribute profits and/or restrict expansion," with failure risking "immediate suspension" of activities [22]. For a company already retaining all earnings and paying no dividend, and holding $1.28 billion of liquidity against a business that consumes little capital, this is a constraint the balance sheet currently swamps — but it is the reason the net-cash position is a working buffer, not idle cash. The same regulatory logic sits behind the 9.99% ownership cap that limits any single holder, and behind eToro's reliance on EU passporting arrangements it may one day have to convert into locally licensed entities [23] (Control and Alignment).
What would change the read
On the evidence, the fear the regulatory overhang provokes is legitimate at the product level, but the fine-and-solvency risk is small and quantified, while the model risk is real, structural and — because of the disclosure gap — unquantifiable from the outside. The read that fits the facts is that regulation caps eToro's addressable market and adds a permanent compliance cost, but is unlikely to break the company; the main risk to that read is a landmark CFD ruling that other regulators copy.
Three developments would move it, each falsifiable in the filings or the docket:
An adverse ASIC judgment with a penalty materially above the $10.3 million provision, or a follow-on class action — visible in the contingent-liabilities note and the Australian court record.
A CFD tightening in the EEA or U.K. — a leverage cut, a marketing ban, or a forced local-licensing reorganization of the Cyprus passporting hub — which would hit the commodities/currencies commission line and part of net interest.
A reversal of the friendlier 2025 U.S. crypto stance (GENIUS/CLARITY), or new CFTC registration and capital demands, which would raise cost and could re-narrow the U.S. crypto menu that has only just widened.
Absent one of those, the numbers say the regulatory book is an expense and a ceiling, not a threat to the going concern.
Capital Allocation
eToro converts profit to cash at a high rate on almost no capital, carries no debt, and ended 2025 with about $1.28 billion of liquid assets. Since its May 2025 IPO the founder-controlled board has begun returning that cash — a $250 million buyback authorization and no dividend — while arming a $250 million revolver explicitly for acquisitions. The record so far is disciplined and shareholder-friendly. The wrinkle a buyer should carry: regulatory capital locked inside operating subsidiaries makes the headline cash less freely deployable than the consolidated number suggests.
The cash the business throws off
eToro is a capital-light operation once the trading engine is built. In 2025 it spent $5.5 million on property, equipment and intangibles against $868 million of Net Contribution — capital expenditure of roughly six-tenths of one percent of scale revenue [1]. Operating cash flow was $318 million and free cash flow $313 million — about 1.45 times the $216 million of reported net income, the cash-conversion signature covered in the financials chapter (Financials and Estimates) [2].
Source: FY2025 Annual Report (Form 20-F), Consolidated Statements of Cash Flows [3].
That cash has accumulated on the balance sheet. At December 31, 2025 eToro held $1,073 million of cash and equivalents plus $203 million of short-term investments — about $1.28 billion of liquidity — against no borrowings, alongside goodwill and intangibles of just $43 million and total equity of $1,395 million [4]. The 2025 IPO added $378 million of primary proceeds net of costs, and the accumulated deficit of $47 million at end-2024 flipped to $168 million of retained earnings [5], [6].
Liquid Assets ($M)
2025 Free Cash Flow ($M)
2025 Capex ($M)
Total Debt ($M)
Source: FY2025 Annual Report (Form 20-F), Statements of Financial Position and Cash Flows [7].
What the board is doing with it
Two decisions define the return policy so far. eToro pays no dividend: the board expects to retain all earnings for operating and expanding the business and does not plan to pay one in the near term, and under British Virgin Islands law can only declare a dividend if the company remains solvent before and after [8]. For a business still growing Funded Accounts and Net Contribution, retention over a coupon is a defensible default rather than a red flag.
The return channel is the buyback. On November 10, 2025 the board authorized a repurchase program of up to $150 million; on November 13 the company entered a $51.1 million accelerated repurchase with Goldman Sachs, and added $10.9 million of open-market purchases through the fourth quarter [9]. By December 31, 2025 it had repurchased 1,568,741 Class A shares for $62.17 million — roughly $39.6 per share on average ($39.55 in November, $38.57 in December) [10]. In February 2026 the board expanded the authorization by a further $100 million — bringing the total program to $250 million — and entered a $50 million accelerated repurchase with Citibank [11], [12].
Source: FY2025 Annual Report (Form 20-F), Item 16E — repurchases began only after the November 2025 authorization [13].
Two things stand out. First, the buyback began roughly six months after the May 2025 IPO — the company was quick to return capital, not slow. Second, it has been repurchasing at $38 to $40 per share — well below the $52 IPO price at which it sold Class A stock only months earlier, and close to the $35.67 the shares traded at on July 31, 2026 [14]. The scale is modest against the resources, though: the $250 million program is about 7 percent of the roughly $3.4 billion equity value at that price, and the 1.57 million shares retired in 2025 were about 1.7 percent of the 95.1 million diluted share count — a program sized closer to one year of free cash flow than to the cash pile.
The acquisition track record
The other claim on the cash is mergers and acquisitions, and here the history is small and additive rather than transformative. eToro's disclosed deals run to bolt-ons: Marq Millions in 2020 (now eToro Money, to cut payment-processing fees), Gatsby in August 2022 (US options), Bullsheet in October 2022 (portfolio tools), Deep in January 2024 (AI content automation) and Spaceship in November 2024 (an Australian investing app) [15]. Spaceship is the largest recent one, and it was still small: total consideration of about $18.5 million, of which only $0.6 million was cash, $12.2 million was stock and $5.7 million was contingent and holdback shares, generating $11.2 million of goodwill [16].
The cumulative footprint of two decades of acquisitions is $43 million of goodwill and intangibles — about 2.4 percent of total assets [17] — with no goodwill impairment recorded in 2023, 2024 or 2025 [18]. There is no swollen goodwill line and no looming writedown to find. The one caution the company itself flags: part of its Funded Account growth is bought, not organic. Spaceship added about 0.2 million Funded Accounts in 2024, roughly half of that year's net growth, and eToro warns its inorganic growth rate is "unpredictable" — a point the moat chapter drew on (Competitive Moat) [19].
Against that backdrop the June 30, 2025 revolving credit facility reads as forward optionality. It is a $250 million senior unsecured revolver from a bank syndicate, three-year term, priced at SOFR plus 3.00 to 3.50 percent depending on leverage, and "intended for general corporate purposes … including the funding of acquisitions" [20]. It is undrawn. A company with $1.28 billion of liquidity and $313 million of annual free cash flow does not need borrowed money for a bolt-on; arranging the line signals appetite for something larger, financed with debt rather than the balance sheet. Whether that appetite is disciplined remains untested, since the deals to date are too small to show.
How much of the cash is actually free
The headline that anchors the through-line — a net-cash balance sheet, near-zero bankruptcy risk — is real, but the figure that matters for capital return is smaller than $1.28 billion. eToro is a regulated broker operating through roughly fifteen licensed entities under about ten regulators, and each regulated subsidiary must hold prescribed capital. The company states plainly that "in many cases, we are not permitted to withdraw regulatory capital maintained by our subsidiaries without prior regulatory approval or notice," and that this "could limit any future decision by our board to declare dividends" [21].
The one subsidiary that quantifies the point is the Cyprus entity. eToro (Europe) Ltd faced a minimum regulatory capital requirement of $160 million at end-2025 and actually held $348 million — a surplus it maintains, not distributes [22]. That single entity alone ring-fences more than a quarter of consolidated liquidity, $160 million of it as a hard floor, and it is one of fifteen. The remaining licensed brokers in the UK, US, Australia, Israel and the Gulf each carry their own requirements, which the company notes rise with business size and with the volatility of the assets — including cryptoassets — that users trade [23].
Sources: FY2025 Annual Report (Form 20-F) — consolidated liquidity [24]; eToro (Europe) regulatory capital [25].
eToro's $1,275 million net-cash floor is ~38% of its $3.4 billion market value and leaves the operating business at an enterprise value near $2.1 billion, ~7.8x consensus 2026 earnings — but $348 million of that cash is regulatory capital ring-fenced in one Cyprus subsidiary ($160 million a hard floor) that cannot be upstreamed without regulator approval, and that entity is one of about fifteen. [26], [27] The forward multiple is carried from the reassembly in Downside and Floor.
This does not undo the net-cash read; eToro remains unlevered and well-capitalized, and the surplus held in Cyprus is a strength for solvency. But it reframes the buyback and dividend headroom. The board is returning capital out of the freely available slice — the corporate cash above what regulators require the subsidiaries to hold — not out of the full $1.28 billion. That is consistent with the modest $250 million program: the company is behaving as though the deployable surplus is a fraction of the consolidated figure, even as earlier chapters treated the whole pile as a floor.
The read
On the evidence, eToro's capital allocation is a mark in favor of the investment case, not against it. Management generates cash on almost no capital, carries no debt, began buying back stock within months of listing at prices below its own IPO, has never overpaid into a goodwill writedown, and pays no dividend it would struggle to sustain through a trading downturn. The strongest fact on the other side is the $250 million acquisition revolver: a founder-controlled board with a combined chair and CEO (Control and Alignment) has given itself borrowing capacity for a deal larger than anything it has done, and the disclosed record is too thin to prove it would deploy that capacity well. What would change the read is a drawn revolver funding a large, dilutive or goodwill-heavy acquisition, or a buyback that stalls while cash keeps building — either would suggest the surplus is being managed for growth optics rather than per-share value. Until then, the capital discipline is genuine, and the deployable cash is smaller than the $1.28 billion headline: about $928 million sits outside the Cyprus entity, and the other licensed brokers hold their own required capital against that balance. Even so, the freely available cushion covers the $250 million buyback program several times over.
Unit Economics
Beneath a reported Net Contribution of $868 million sits a business of 3.81 million funded accounts, each monetized at roughly $228 a year [1]. That per-account figure jumped about 24% in 2024, then held flat in 2025. The flat headline hides a mix shift: durable per-account monetization — trading spreads, net interest, banking — kept climbing while crypto reverted from its 2024 peak. 2025's growth was account-led, not monetization-led — a different, and more repeatable, source than the one that drove the 2024 step-up.
This chapter takes the durability question (Financials and Estimates) down to the account level: how many users pay, how much each pays, where that payment comes from, and what it costs to add the next one.
The funnel: a slow, steady account base
Funded accounts — users who have passed onboarding, deposited, traded, and hold a positive balance — are the population eToro monetizes [2]. That base has grown steadily but slowly: from 3.04 million at the end of 2023 to 3.48 million in 2024 and 3.81 million in 2025 [3].
Source: FY2025 Annual Report (Form 20-F), Key Performance Metrics — Funded Accounts [4].
Net additions run at roughly 0.2 to 0.4 million a year: about 0.2 million in 2023, 0.4 million in 2024, and over 0.3 million in 2025 [5]. Part of the 2024 figure was bought, not built: the November 2024 acquisition of the Australian app Spaceship added about 0.2 million accounts, visible as the one-quarter jump from 3.21 million to 3.48 million [6]. Stripping that out, organic net adds sit near 0.2 million in 2024 and improve to over 0.3 million in 2025 — an organic acceleration, but off a base that is compounding in the high single digits, not doubling. Management is candid that inorganic growth "is unpredictable" and that no acquired accounts were added in 2023 [7]. The account-growth channel is real but low-geared; the growth in Net Contribution has to come mostly from monetizing the accounts already there.
Monetization per account: the durable line rises as crypto reverts
Dividing Net Contribution by year-end funded accounts gives a monetization-per-account figure that rose 24% in 2024 and then went flat in 2025. Split into its durable base (equities/commodities/currencies spreads, net interest, eToro Money banking, subscriptions) and its crypto-trading swing, the flat headline resolves into two opposite moves.
Source: derived from Net Contribution components and year-end Funded Accounts, FY2025 Annual Report (Form 20-F) [8]; [9].
Durable monetization per account climbed each year — roughly $165, $171, then $187 — a cumulative 13% gain driven by the net-interest line and steady trading spreads. Crypto monetization per account spiked from about $18 in 2023 to $55 in 2024, then fell back to $41 in 2025 as the post-election crypto rally faded [10]. The plateau in the total is a coincidence of timing, not a stall in the business: the part eToro can most rely on kept rising, and the part it can least control gave back a chunk of a one-off peak.
That reframes the 2024-versus-2025 growth story. In 2024, Net Contribution grew 42%: accounts rose about 15% and monetization per account about 24%, so the year was monetization-led — and much of that lift was crypto and the first full year of higher rates [11]. In 2025, Net Contribution grew 10%: accounts rose about 9.5% and monetization per account under 1%, so the year was almost entirely account-led [12]. For a reader weighing whether 2025 is a cycle high, the useful distinction is that the two growth drivers are not equally repeatable: crypto-led per-account gains are not, an account base compounding at 9% is more so, and the durable per-account rise of low-double-digit percentages over two years is the quietest and most repeatable of the three.
Per-trade economics: one line mean-reverts, the other swings
Underneath the trading contribution sits a per-trade take rate that behaves very differently across the two asset groups. Users executed 594 million trades in 2025, up from 571 million in 2024 and 446 million in 2023; of these, 537 million were in equities, commodities and currencies and 57 million in cryptoassets [13].
Source: FY2025 Annual Report (Form 20-F), Trades and Net Trading Contribution per Trade [14].
The traditional book earns a remarkably stable $0.54 to $0.94 per trade across twelve quarters, with no discernible trend — its contribution grows through trade volume, not price [15]. Equities/commodities/currencies trading contribution rose from $306 million to $400 million over two years on roughly matching trade-count growth [16]. Crypto per-trade economics are the volatile input: $1.14 to $4.13 per trade, spiking to $4.13 in the fourth quarter of 2024 and $3.47 in the third quarter of 2025, because crypto spreads widen with the relative illiquidity of the asset being traded [17]. Crypto's share of trading commission moved from 17% in 2023 to 38% in 2024 and back to 29% in 2025, and it was 38% of all Net Contribution in the single quarter after the U.S. election before equities took 54% of Net Contribution in the tariff-driven second quarter of 2025 [18]; [19]. The multi-asset mix does work as a hedge — but the swing factor in the take rate is the same crypto line that swings everything else.
The balance-sheet engine: assets deepen, take rate compresses
The most durable part of the model is monetization of user balances. Assets under administration — cash and holdings in funded accounts — nearly doubled to $16.6 billion in 2024 and reached $18.5 billion in 2025, from $9.6 billion in 2023 [20]. Interest-earning assets rose to $7.2 billion [21] and total money transfers to $11.6 billion [22]. Those balances feed a net-interest contribution that grew from $144 million to $217 million over the period [23].
Source: FY2025 Annual Report (Form 20-F), Growing our User Base and Expanding our Relationship with Existing Users; take rate derived [24]; [25].
Two readings sit inside this table. The bullish one: the platform is accumulating assets faster than accounts, which is exactly the "deepen the relationship" flywheel management describes, and over 20% of new funded accounts in 2025 were users who had registered in 2024 or earlier — delayed conversions, not fresh acquisition [26]. The cautious one: Net Contribution as a share of assets under administration compressed from 5.8% to 4.7%. As balances grow, eToro monetizes each incremental dollar less intensively — partly mix (net interest is a thinner take than crypto spreads), partly the rate-sensitivity of that interest line. The deepening is genuine; the take rate on it is not expanding.
What it costs to fill the funnel
Selling and marketing rose to $209 million in 2025, up 17%, after a 19% rise to $178 million in 2024 [27]. Research and development reached $151 million, or 17.4% of Net Contribution [28].
Source: FY2025 Annual Report (Form 20-F), Selling and Marketing and Research and Development, as % of Net Contribution [29]; [30].
Marketing intensity fell in 2024 as the crypto-inflated Net Contribution swelled the denominator, then rose back to 24.1% of Net Contribution in 2025 — spend grew 17% while Net Contribution grew 10% and net account adds slipped from 0.4 million to 0.3 million [31]. On a headline basis, then, 2025 marketing bought fewer net accounts per dollar; adjusting for the ~0.2 million of Spaceship accounts inside 2024's figure, organic acquisition cost per net account improved modestly. Both readings are defensible, and the filing does not disclose acquisition cost, payback, or churn directly, so this is bounded rather than precise. The clearest fact is that Net Contribution growth is not coming from marketing leverage: the platform is spending a steady-to-rising share of contribution to hold its acquisition pace.
CopyTrader: engaged users, concentrated copy assets
eToro's differentiator is engagement, and the engagement numbers are genuinely high: the average user logs in about four times a day for roughly twelve minutes, 53% of funded accounts hold more than one asset class, and 92% of users made an equity, crypto or copy trade as their first action in 2025 [32].
Logins per day (avg)
Minutes per session
Hold 2+ asset classes
Median user age
Source: FY2025 Annual Report (Form 20-F), Our Users and Engagement [33].
The social layer that drives that engagement is concentrated in a strikingly small group. eToro had over 4,750 members of its Pro Investor program at the end of 2025, but only 17 of them held more than $10 million in Assets Under Copy and 125 held more than $1 million [34].
Source: FY2025 Annual Report (Form 20-F), Pro Investor Program; the $1M–$10M and under-$1M bands are derived from the disclosed 17 over $10M and 125 over $1M [35].
Copy assets concentrate in a handful of star investors — a design that makes the network engaging and cheap to run, but also means a small number of departures or performance blow-ups could dent the feature that distinguishes eToro. The moat's genuine depth is not disclosable from the filing: eToro does not report total Assets Under Copy, the share of Net Contribution that rides on copied trades, or Pro Investor churn, and it flags that some users have "misused the Pro Investor program by fraudulently copying each other's positions" to inflate fees [36]. What the filing does show is reach: 84% of copiers copy an investor in a different country [37].
What this means for the forward case
The unit economics say the 2026 consensus for Net Contribution near $968 million (Financials and Estimates) does not need another crypto year. Roughly 9% account growth plus a continued mid-single-digit climb in durable per-account monetization would carry most of the way there, with crypto as upside rather than the load-bearing assumption. The first quarter of 2026 is consistent with that: funded accounts reached 4.02 million, up 12% year-on-year, an acceleration in the account line [38].
The main risk to that read is that the durable base is not fully insulated: the net-interest line that carried per-account monetization in 2024–2025 falls with rate cuts, and the take rate on a still-growing asset base is compressing, not expanding. What would settle it is watchable in each quarterly release — the funded-account run-rate against the ~0.3 million annual pace, durable (ex-crypto) Net Contribution per account, and selling-and-marketing as a share of Net Contribution against the 24% it printed in 2025. If durable per-account monetization keeps grinding higher while account adds hold, the 2025 profit looks like a base; if the durable line flattens as crypto normalizes, 2025 looks closer to a peak.
Quarterly Trajectory
The five quarters since eToro began reporting as a public company are the first live test of whether 2025 was a cycle high, and they read against that fear. eToro's 2025 Net Contribution growth came entirely from its non-crypto base of $713 million even as crypto-trading contribution fell to $155 million, and by Q1 2026 it set a record $258 million of Net Contribution with crypto down to about $13 million because capital-markets contribution rose 71% to a record $166 million. That record quarter lifted net income 37% to $82 million even as gross revenue swung by nearly two-to-one [1]. Capital-markets trading grew 71% year over year to a record $166 million [2]. Net trading contribution from crypto fell to about $13 million over the same period [3]. The full-year split of the non-crypto base against crypto is set out in Financials and Estimates. The durability is real, and it is diversified cyclicality rather than the end of cyclicality.
Five quarters, one direction
eToro has now printed a full year of public quarters, Q1 2025 through Q1 2026. The through-line for this report is whether the profitability that turned in 2023 is durable or merely well-timed (The eToro Setup); the quarterly cadence is where that question stops being annual arithmetic and starts being observable.
The record for the period is stable, not spiky. Net Contribution — management's economic top line, gross revenue less the near-offsetting cost of crypto revenue and margin interest (Financials and Estimates) — ran $217 million, $210 million, $215 million, $227 million, and $258 million across the five quarters [4] [5] [6] [7]. The four 2025 quarters summed to the reported full-year record of $868 million [8].
Source: eToro quarterly results releases, Q1 2025 – Q1 2026; Q1 2025 figures are the prior-year comparatives disclosed in the Q1 2026 release [9] [10] [11] [12].
Net income has a wider spread than Net Contribution, and the low point has a name. Second-quarter 2025 profit of $30 million was the softest reading, but it included roughly $15 million of IPO and related costs; the underlying figure was closer to $45 million [13]. From there earnings climbed each quarter — $57 million, $69 million, $82 million — with the last reading up 37% year over year and a record for the company as a public listing [14] [15] [16]. A business whose earnings supposedly live and die with a single volatile market did not, across five quarters, produce a single loss or even a flat-to-down sequential trend after the IPO charge cleared.
Gross revenue versus Net Contribution
The reason the crypto-casino label misreads eToro is that its reported top line and its economics move on different axes. Total revenue and income — the GAAP top line — swung from $3.76 billion to $2.09 billion to $4.11 billion to $3.87 billion to $2.44 billion over the same five quarters [17] [18] [19] [20]. Net Contribution over the same window barely moved.
Source: eToro consolidated statements of income, Q1 2025 – Q1 2026. Gross revenue is dominated by cryptoasset notional, almost entirely offset by cost of revenue from cryptoassets; Net Contribution (right) held a $210–258M range throughout [21] [22].
The mechanism is the cryptoasset pass-through. In the first quarter of 2026, $2.15 billion of revenue from cryptoassets was matched by $2.17 billion of cost of revenue from cryptoassets; the gross line is notional that flows in and out with almost no residual [23]. Across full-year 2025, $12.98 billion of crypto revenue carried $12.93 billion of crypto cost [24]. What reaches the platform is the spread, and the spread has been steadier than the volume that generates it. The quarter-to-quarter gross line is a measure of crypto turnover, not of eToro's earnings power.
What powered the record
The first quarter of 2026 is the cleanest single data point for the durability case, because the record was set with crypto quiet. Management attributed the 19% rise in Net Contribution "primarily by increased commodities trading activity," and on the call framed the quarter as "a confirmation of our strategy as trading continued to shift from crypto to commodities" [25] [26]. Commodities reached 60% of trading commissions, with volumes up nearly fourfold year over year [27].
The business-line split shows the rotation squarely. Net trading contribution from capital markets — equities, commodities and currencies — grew 71% year over year to a record $166 million, while the crypto component fell to $13 million [28]. Net interest contributed $48 million, down 5% on lower rates and user deleveraging, and eToro Money grew 32% to a record $29 million [29].
Source: eToro Q1 2026 earnings call for the line contributions; capital-markets net trading income of $165.6M and the crypto lines both appear in the consolidated income statement, which carries the prior-year column — crypto Net Contribution of roughly $49M in Q1 2025 fell to about $13M, a ~73% decline [30] [31].
The multi-asset claim is that these are the same users moving across products, not different cohorts arriving and leaving. Management said that over the prior six months, "users who initially traded crypto or equities accounted for most of the commodities trading volume," and that 40% of customers who traded commodities in the first quarter also traded stocks or crypto in April [32]. That is the through-line's best supporting evidence: the platform captured commodity volatility with the book it built for crypto and equities.
Accounts and margin, both accelerating
The account base inflected upward in the same quarter. Funded accounts rose to 4.02 million, up 12% year over year and the fastest organic growth in over a year, and management reported momentum carrying into April at 4.07 million accounts, up 13% [33] [34]. The sequential net add of roughly 210,000 accounts was the largest in the set, after adds nearer 50,000 to 100,000 in the middle 2025 quarters (Unit Economics).
Operating leverage showed up in the gap between the top and bottom lines. With Net Contribution up 19%, diluted earnings per share rose 25%, from $0.69 to $0.86 [35]. That is the pattern consensus is counting on for 2026–27 — earnings growth running ahead of Net Contribution growth (Financials and Estimates) — appearing in the freshest actual quarter. The buyback added to per-share momentum: eToro repurchased about 3.3 million shares for $103 million in the quarter, more than its entire 2025 repurchase to that point (Capital Allocation) [36].
The counter-case: rotation is not immunity
The record shows that eToro rotates its cyclicality across asset classes rather than escaping it. Two of the largest historical swing factors were both fading in the record quarter: crypto net contribution had collapsed to $13 million, and net interest was declining as rates eased [37]. What filled the gap was commodities, and commodity volatility is no more permanent than crypto's — management's own guidance for the rest of the quarter was that it is "really up to the markets" [38]. Net interest also fell 5% in the record quarter, on lower rates and user deleveraging [39], so two of the platform's swing factors were fading while commodities carried the quarter. The model needs something, somewhere, to be moving, and it has never been tested by a quarter in which every asset class is quiet at once. That untested case is the one the rotation read does not cover, and it is worth sizing: a full reversion of trading activity and interest rates together takes Net Contribution back to roughly $662 million and net income to about $65 million, with a deeper-bear path near $35–40 million. Both are lower than the 2025 result, and both remain profitable and free-cash-flow positive (Downside and Floor).
The set also contains one year-over-year decline, and it is worth stating plainly. Fourth-quarter 2025 Net Contribution fell 10%, to $227 million from $253 million a year earlier — the toughest comparison in the window, set against a Q4 2024 that had been lifted by crypto's post-election run [40]. Full-year crypto Net Contribution had already retreated from $193 million in 2024 to $155 million in 2025 (Financials and Estimates). The rotation cushioned that decline; it did not prevent the one down-quarter.
And the account acceleration is being bought. Management is scaling sales and marketing from 21% of Net Contribution in 2025 toward 25% in 2026 to sustain growth, with customer-acquisition costs already up $12 million in the first quarter [41]. Faster funded-account growth is real, but it carries a rising bill that will show up in the operating-leverage math if Net Contribution per account does not keep pace (Unit Economics).
What would change the read is specific: a quarter in which Net Contribution falls even though volatility is elevated somewhere on the platform — the sign that the multi-asset capture is slipping — or one in which commodities normalize without crypto, equities, or rates picking up the slack. Absent that, the five-quarter record says the profitability that turned in 2023 has held its footing through a live rotation out of the asset the market most fears, with the newest quarter its strongest. The record does not remove the cyclicality; it shows that the cyclicality now moves across asset classes rather than tracking crypto alone. The next contraction will test whether the platform can capture the next moving market when the current ones go quiet.
Downside and Floor
At $35.67 — about 31% below its May 2025 IPO — eToro carries roughly $13.41 a share of net cash and no debt [1]. The headline number, though, overstates how much of that cash a shareholder can actually take out. eToro's $1,275 million net-cash floor is ~38% of its $3.4 billion market value and leaves the operating business at an enterprise value near $2.1 billion, ~7.8x consensus 2026 earnings — but $348 million of that cash is regulatory capital ring-fenced in one Cyprus subsidiary ($160 million a hard floor) that cannot be upstreamed without regulator approval, and that entity is one of about fifteen. [2][3] The offset sits in the same figures: eToro remains unlevered with zero debt, and the Cyprus surplus held above its requirement is itself a solvency strength — the ring-fence trims the returnable headroom, not the near-zero-bankruptcy read. This chapter sizes the four levers that could pull 2025's $868 million Net Contribution and $216 million net income lower against that floor [4]; the business stays profitable through a plausible reversion, and the mid-teens earnings multiple prices little of 2025 as a peak.
What the price implies
The earlier chapters established the pieces separately — a diversified but pro-cyclical Net Contribution, a founder-controlled cap table, a bounded moat, a real but structural regulatory exposure, and a disciplined capital-allocation record on a debt-free balance sheet. Reassembled at the current price, they set the terms of the trade.
Share price (Jul 31 2026)
Net cash per share
Net cash as % of price
2026E P/E (x)
Source: net cash of $1,275 million (cash $1,072.6M plus short-term investments $202.7M, no financial debt) over 95.1 million diluted shares, FY2025 Annual Report (Form 20-F) [5] [6]; forward P/E on $2.84 consensus 2026 EPS.
Two figures anchor the downside. The company holds $1,275 million of cash and short-term investments against no financial debt — about $13.41 for each of its 95.1 million diluted shares, or close to 38% of the quoted price [7] [8]. That cash is not all freely returnable — subsidiary regulatory capital ring-fences a portion of it, as the capital-allocation chapter showed — but it is a solvency cushion, and with zero debt the chance of the balance sheet failing is remote. The second figure is the earnings the market is pricing: $216 million of net income in 2025, up from $15 million in 2023, on a 24.9% net margin on Net Contribution that is itself a cycle high [9].
The four downside levers
The reversion case is not a crash; it is the ordinary contraction a retail-activity platform sees when trading cools and rates fall. Four levers do the work, and three of them can be sized from the company's own components.
Crypto trading is the largest and most volatile. Its Net Trading Contribution swung from $56 million in 2023 to $193 million in 2024 and back to $155 million in 2025 — and within 2025 alone it ran from $27 million in one quarter to $56 million in the next [10]. A reversion to the 2023 full-year base subtracts about $99 million.
Net interest — $217 million, a quarter of Net Contribution — is a function of short-term rates on client and corporate cash, and eToro quantifies its own sensitivity: a 150-basis-point move changes net income by roughly $39 million [11]. A rate-cut cycle of that order takes roughly $47 million off the pre-tax base.
Equities, commodities and currencies trading — $400 million, the steadiest large line and the one management calls a "natural hedge" across asset classes — still moves with volumes; it was $307 million in 2023 [12] [13]. A 15% activity contraction removes about $60 million. eToro Money and subscriptions ($96 million combined) are the stickiest components and are held flat.
Source: derived from FY2025 Net Contribution components (crypto and equities/commodities/currencies lines) and the disclosed interest-rate sensitivity, FY2025 Annual Report (Form 20-F) [14] [15].
A downside Net Contribution near $662 million sits between 2023's $557 million and 2024's $787 million — a real setback, but above where the company already ran a profitable year [16]. What the earnings do from there depends on the cost base. Operating costs were $615 million in 2025 against $529 million in 2023, and marketing — up $30 million last year — is the flexible lever management can pull in a downturn [17]. Holding costs near $575 million leaves roughly $87 million of pre-tax profit; at a normalized ~20% tax rate — above 2025's 14.9% low — net income lands near $65 million. A harder reversion, toward the 2023 revenue level with a stickier cost base, compresses net income toward $35–40 million. In neither case does the business lose money, and free cash flow, which ran at $313 million in 2025 on about $5 million of capex, stays positive [18].
Rates cut both ways, but in a bounded band
The rate lever is worth isolating because the company discloses the arithmetic. Its own sensitivity table shows the impact of higher rates on net income; read symmetrically, it is also the cost of cuts.
Source: hypothetical interest-rate impact on total net income, FY2025 Annual Report (Form 20-F), Market Risk disclosures [19].
Each 100 basis points is worth about $26 million of net income at 2025's balances [20]. That is material against $216 million of earnings, but it is not a cliff: even a 150-basis-point cut removes roughly $39 million, because eToro also charges margin interest on leveraged positions, which partly offsets a fall in what it earns on deposits. The rate lever hurts, and it hurts the "durable" base rather than the crypto swing — but within a band a professional investor can bound in advance.
Base and upside
Against that downside, consensus and the most recent quarter point the other way. Analysts model Net Contribution near $968 million in 2026 and $1,069 million in 2027, with diluted EPS of $2.84 and $3.35 — and the first quarter of 2026 came in ahead of that path, with Net Contribution up 19% to $258 million, net income up 37% to $82 million, and funded accounts up 12% to 4.02 million [21]. The scenario table below carries each case to the multiple it implies at today's price.
Sources: downside derived from FY2025 components as above [22]; base and upside from analyst consensus (12 analysts, revenue and EPS), as of Aug 1 2026; Q1 2026 actuals per the quarterly release [23].
The table frames the asymmetry plainly. The base and upside cases put the stock at 12.6 and 10.6 times earnings — undemanding for a debt-free, cash-generative platform still growing accounts and monetization. The downside case does not deliver a cheap trough multiple; at roughly $65 million of net income the same price is about 52 times earnings. The cushion in a reversion is therefore not a low P/E on depressed earnings — it is the $13.41 of net cash per share and the fact that the business keeps earning. That distinction matters for a margin-of-safety buyer: the protection here is balance-sheet-led, not multiple-led.
What the below-IPO price reconciles to
Reassembled as enterprise value, the arithmetic is concrete. At $35.67 the equity is worth about $3.4 billion; strip the $1,275 million of net cash and the operating business carries an enterprise value near $2.1 billion — roughly 9.8 times the $216 million earned in 2025 and about 7.8 times the $270 million consensus models for 2026 [24] [25]. The same shares were sold at $52.00 in the May 2025 IPO, an equity value near $5 billion fourteen months earlier [26]. A single-digit multiple of enterprise value to earnings credits almost no growth beyond 2025 and treats the year's profit as closer to a plateau than a base.
Whether 2025 was a cycle high is unresolved, and the evidence assembled across the prior chapters cuts both ways rather than settling it by assertion: net income grew 12% in 2025, but pre-tax profit rose only $8 million and the gain leaned on a tax rate that fell to 14.9% (Financials and Estimates); the durable base is genuinely larger than the crypto label implies, yet a quarter of it is rate-sensitive net interest and much of the trading base is leverage-linked and regulator-exposed (Regulatory Exposure). A value buyer gets a founder-aligned, net-cash, through-cycle-profitable franchise at a single-digit operating multiple, where the margin of safety comes from the balance-sheet floor rather than from a depressed multiple on normalized earnings.
What to watch
The reversion case is falsifiable. Six lines, each in a specific filing, decide which scenario the next two years track.
Sources: crypto and net-interest components and the rate-sensitivity and tax lines, FY2025 Annual Report (Form 20-F) [27] [28] [29]; regulatory matters at [30].